...
| Section |
|---|
| Column |
|---|
|  |
| Column |
|---|
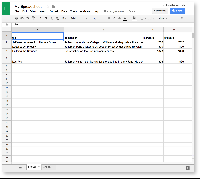
| Now, fill in your data for each cell. You'll see from the Timeline guide that each row represents an event on the timeline. We've entered four events in the example to the left. This data was taken from the Thomas Jefferson Foundation's website. |
|
Now that you’ve entered your data, it’s time to format it.
...
| Section |
|---|
| Column |
|---|
|  |
| Column |
|---|
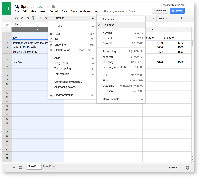
| To set the data type, select your column. Click Format from the menu, then Number. Choose Plain Text. Do this for each column. |
|
...
Now your data is ready to go, and you can move to Mandala Audio-Video.
4. Log in to visuals
| Section |
|---|
| Column |
|---|
|  |
| Column |
|---|
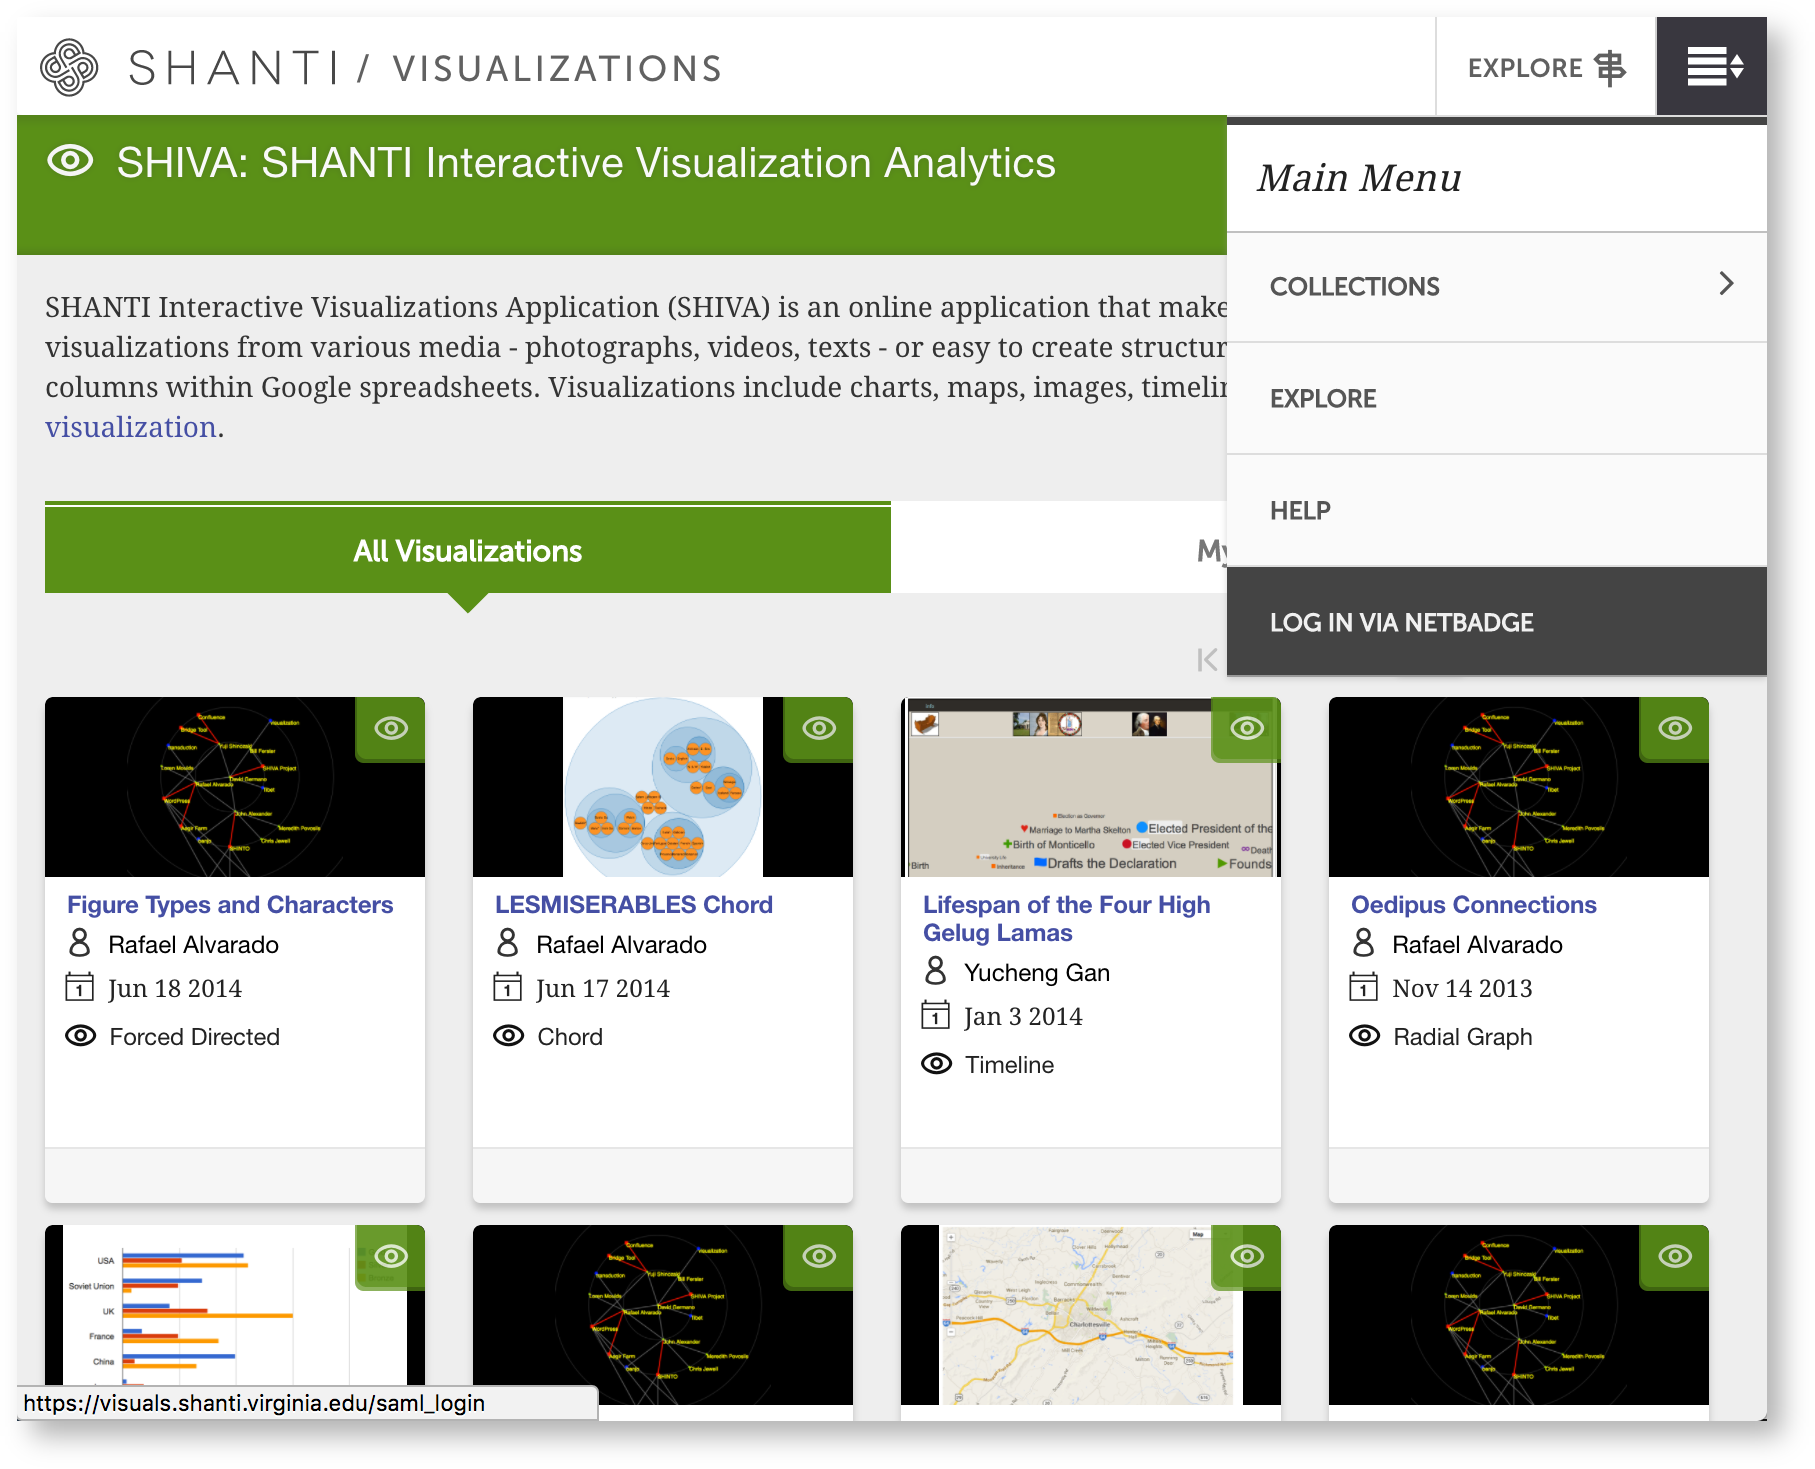
| Click on the Main Menu icon ( ) in the top right corner. Then, Log in via Netbadge. ) in the top right corner. Then, Log in via Netbadge. |
|
...
| Section |
|---|
| Column |
|---|
| 
|
| Column |
|---|
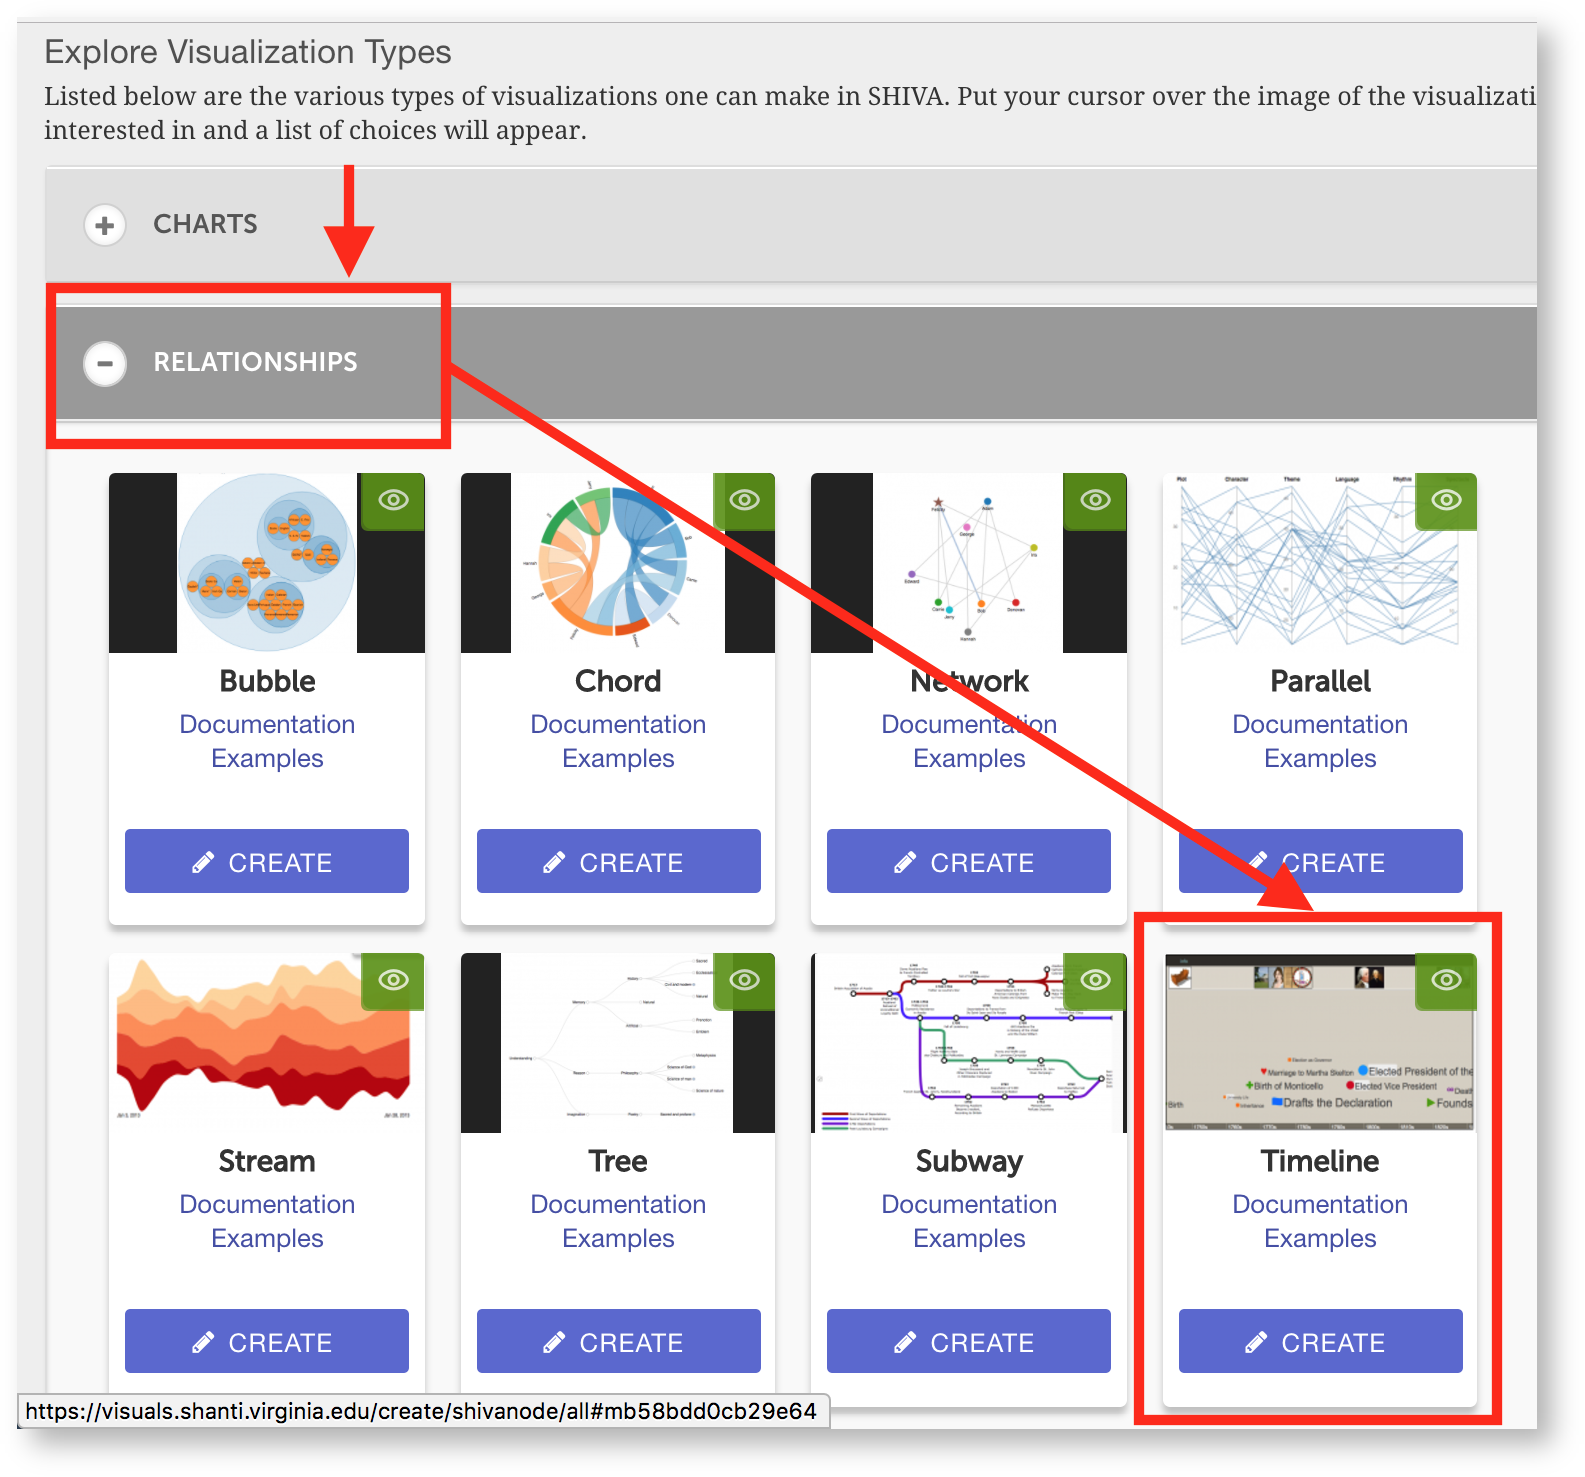
Choose Relationships, then Timeline. |
|
...
| Section |
|---|
| Column |
|---|
| 
|
| Column |
|---|
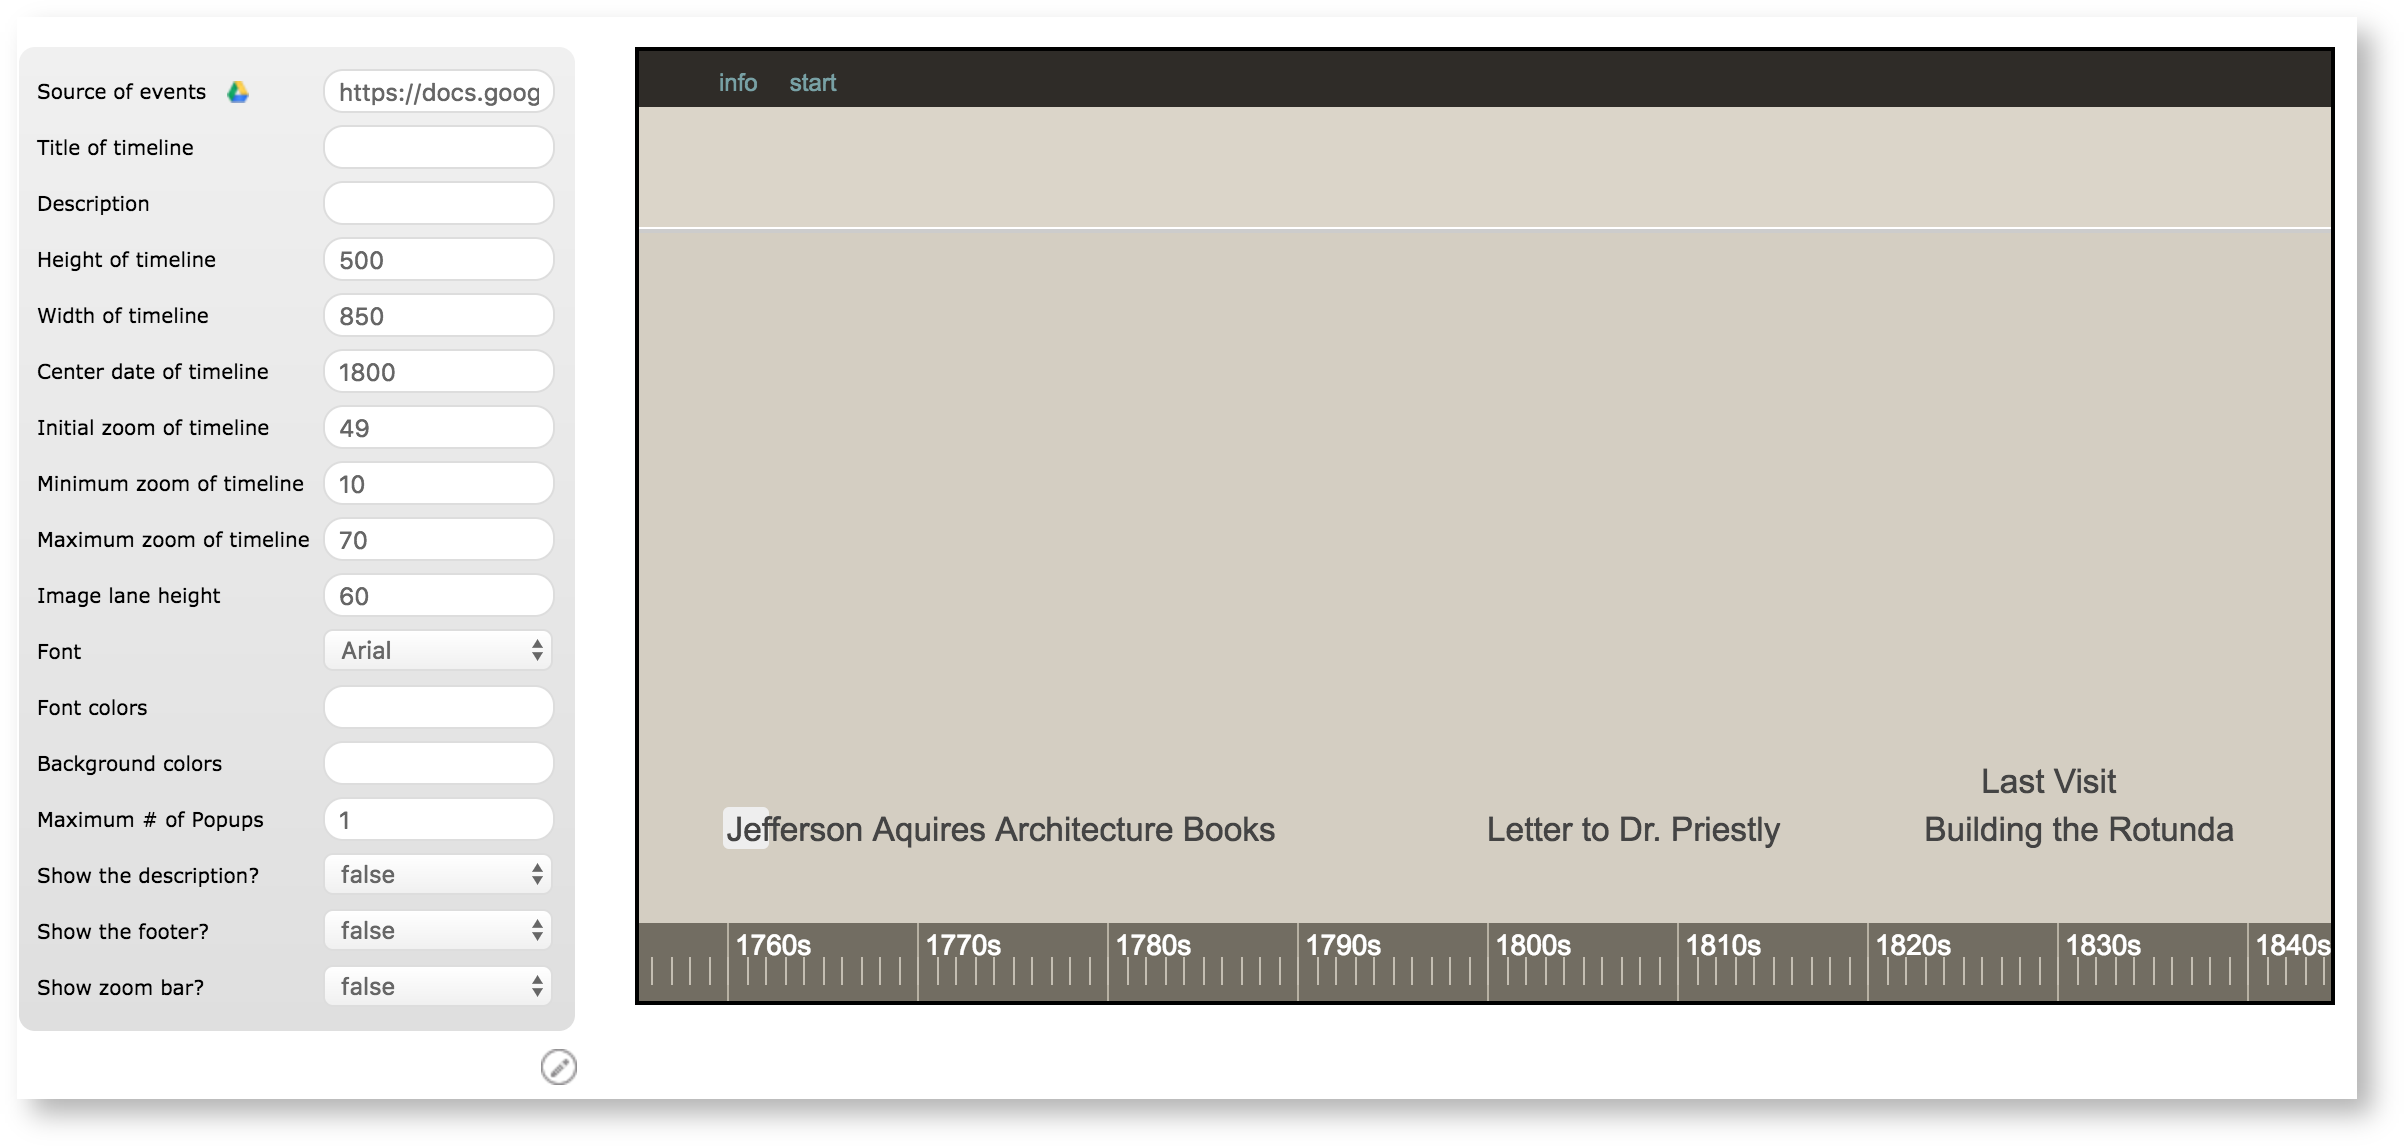
First, set "Center date of timeline." 1800 seems like a good place to center the timeline, so we'll enter "1800" in the field. If you want to set a specific day, you would use the month/day/year format ("01/25/1800"). |
|
...
| Section |
|---|
| Column |
|---|
|  |
| Column |
|---|
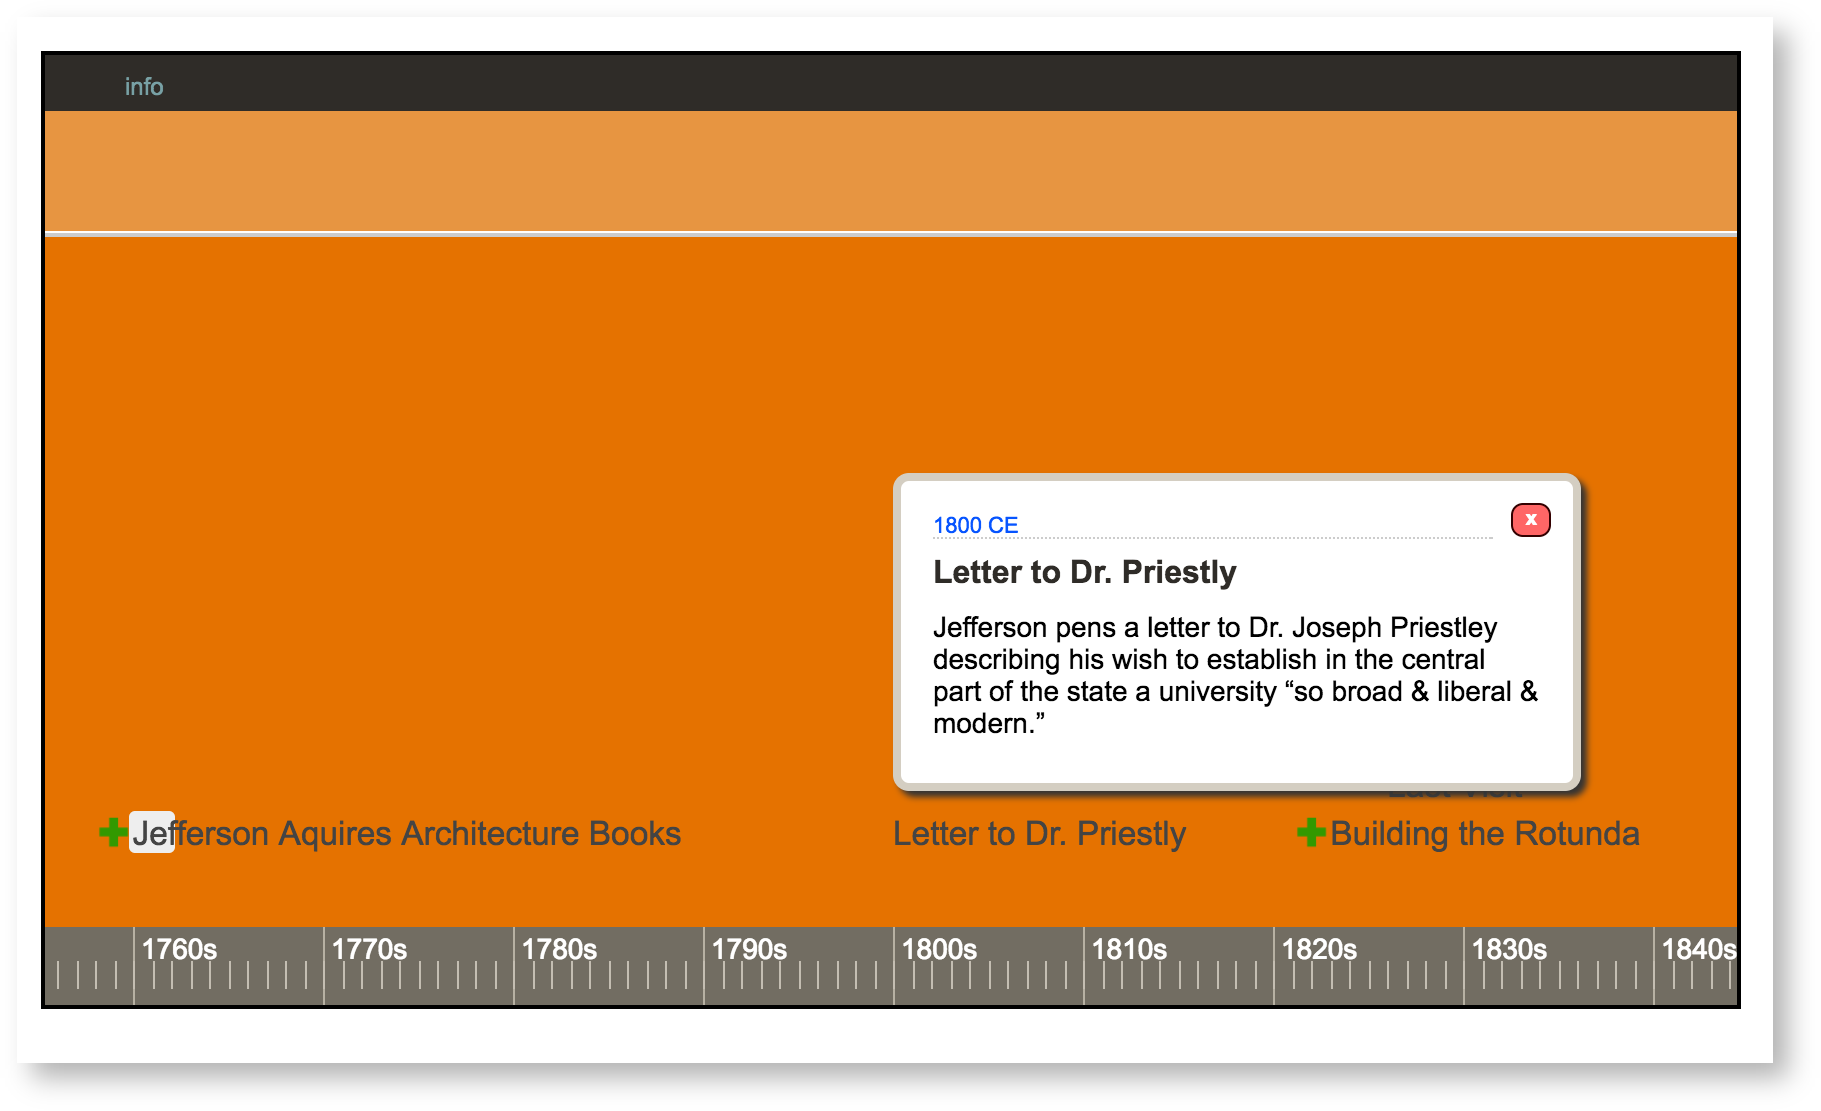
This is what your timeline should look like. |
|
...