...
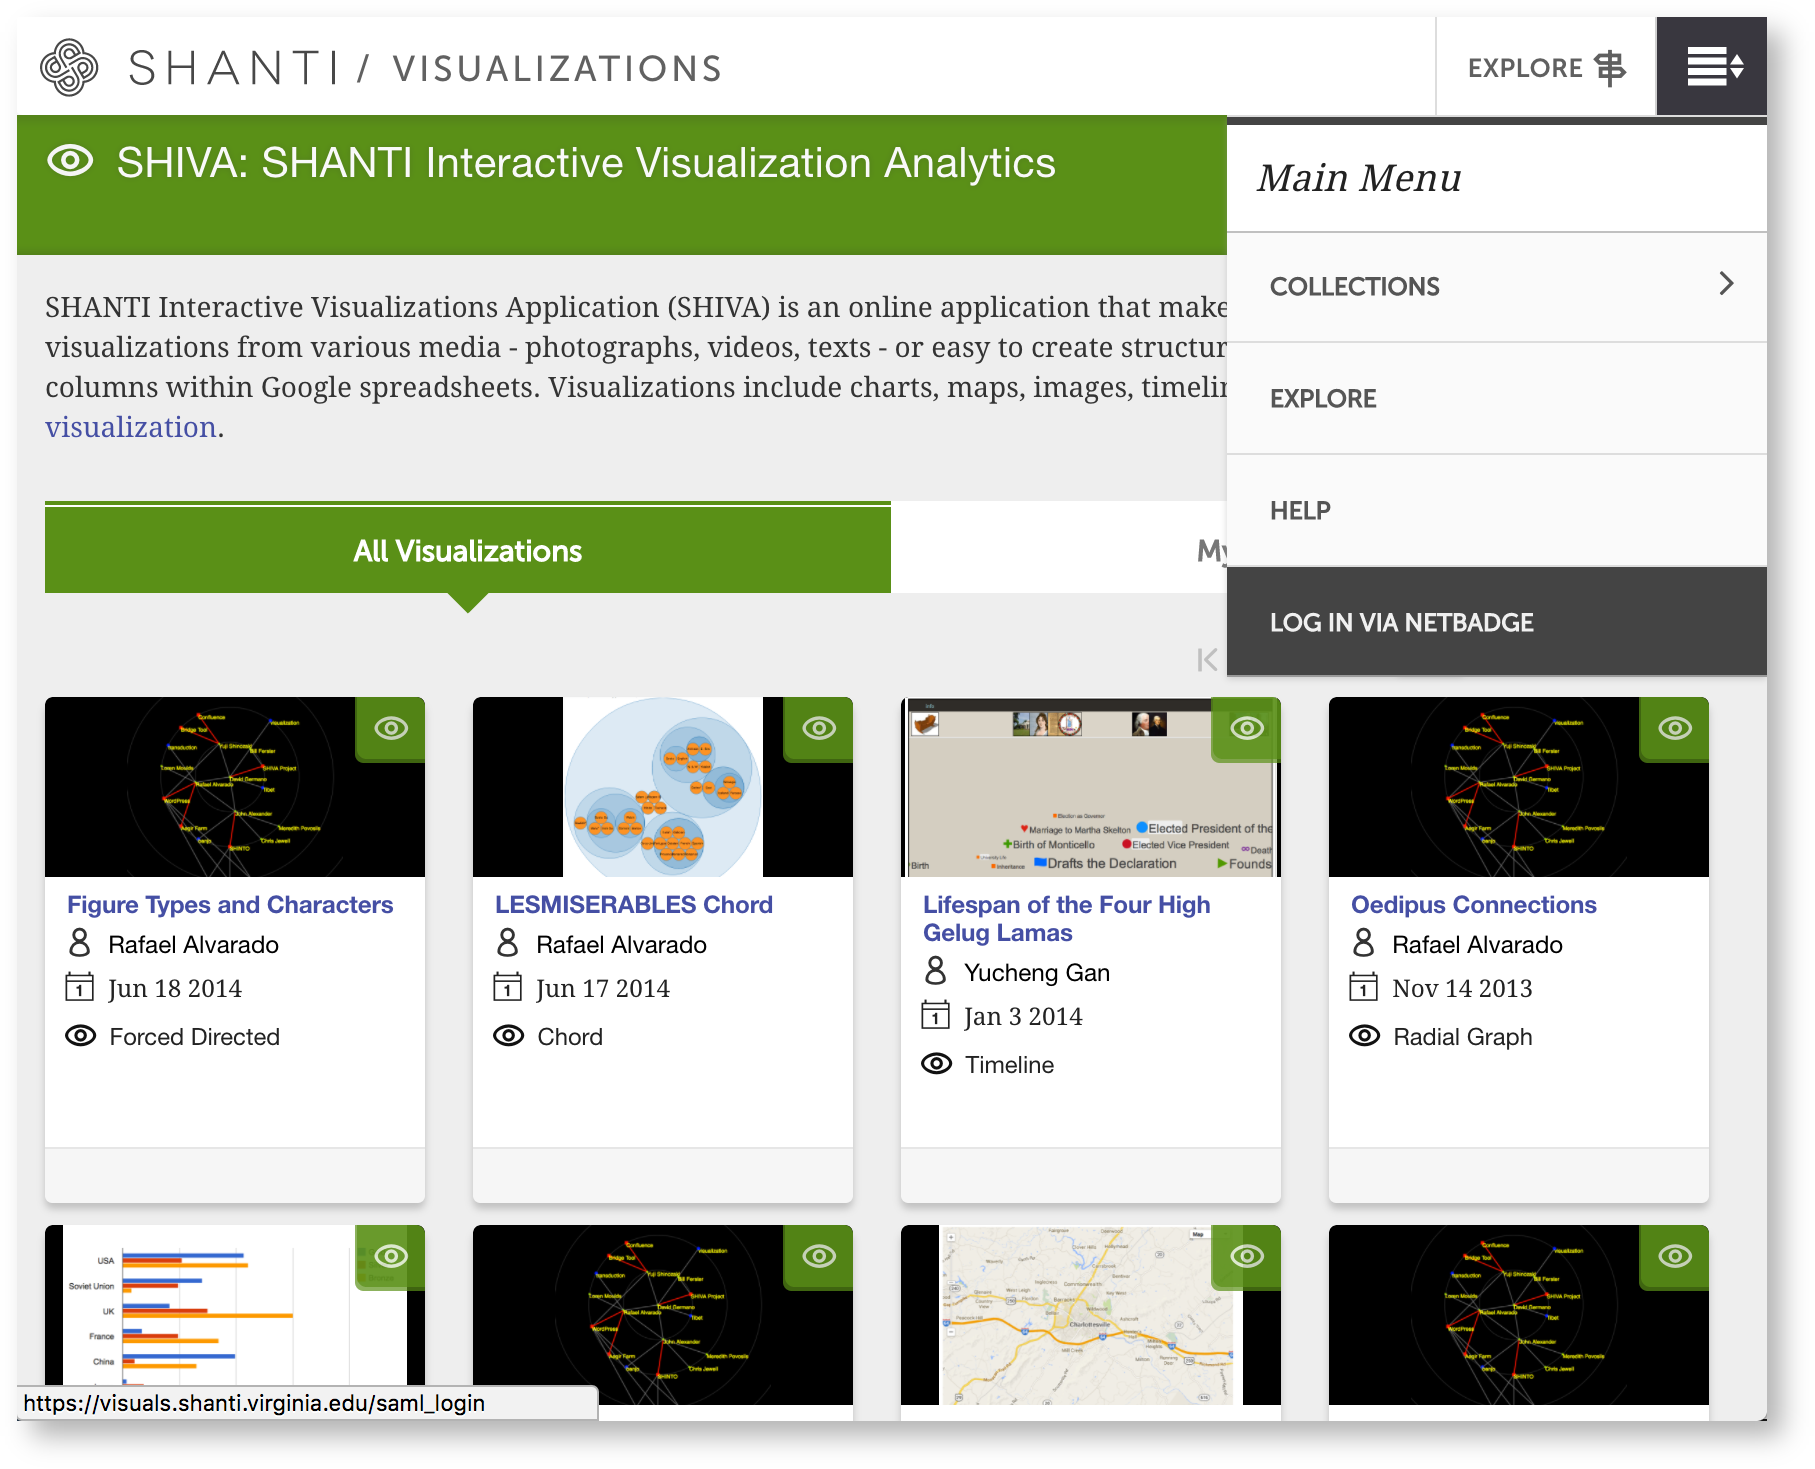
Go to the external visuals.shanti.virginia.edu. Click on the Main Menu icon () in the top right corner. Then, Log in via Netbadge.
Enter your Netbadge credentials to finish logging in. Now we'll connect your Visuals account to your Google Drive accountmake your visualization.
Anchor create create
6. Create your timeline
| create | |
| create |
...
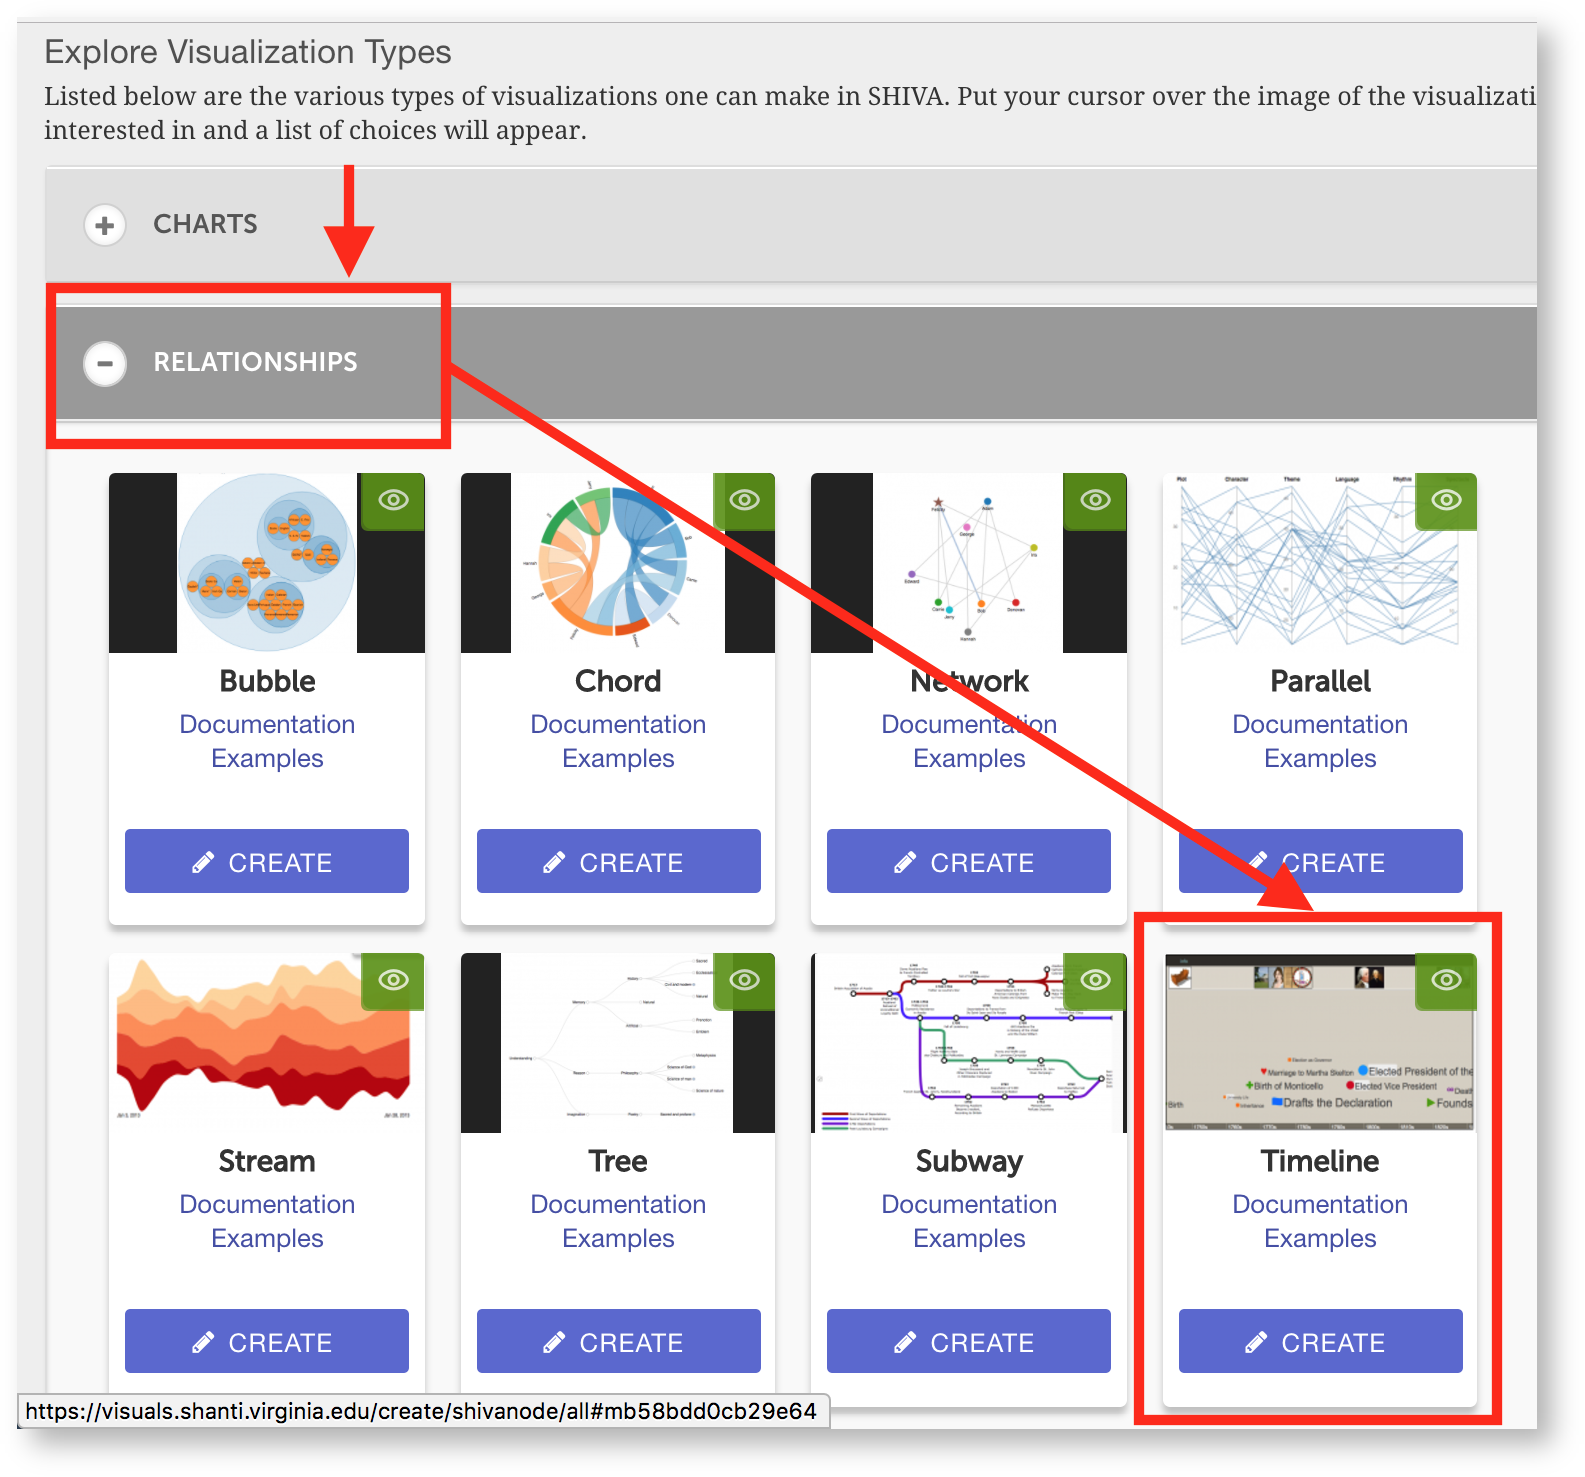
Choose Relationships, then Timeline.
You'll see the visualization editor and a list of spreadsheets on preview of your timeline. Now we need to add your spreadsheet to the editor. Find the "Source of events" field and click on the triangle Google Drive icon next to it. You'll see a list of your Google Drive . Click Visualize as timeline next to the spreadsheet with your timeline data.You'll see the visualization editor and a preview of your timeline.accounts. Log in to the account you used to make your spreadsheet.
Google will ask if you give Shanti permission to see your files: click Allow. You'll see a Google Drive window in Visuals with a list of your files.
Select the spreadsheet you made in step 1.

Now we'll use the options in the sidebar to customize your timeline.
...