| Excerpt |
|---|
All of these resources are connected by Knowledge Maps, which are taxonomies or ontologies of terms. Knowledge Maps let you group different types of media by tagging each resource. |
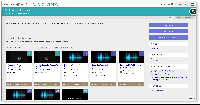
| Gallery | ||||||
|---|---|---|---|---|---|---|
|
Overview
This guide walks you through the process of making this project. To recreate the resources above:
- Add resources to Mandala, using the Audio-Video, Sources, Visuals, and Texts tools
- Create new Knowledge Map ontologies
- Label resources with Knowledge Maps
1. Add your resources
Before you connect or tag resources with Knowledge Maps, you need to add your resources. Each type of media has its own Mandala tool website, but the process is always the same. You'll create a collection to house your resources, along with any subcollections you need. Then, you'll add your resources to the collection. Remember, you'll need to switch tools every time you add a different type of media. Make sure to use:
...
This guide walks you through adding sound and video slowly. After that, you'll use similar steps for each tool, so this tutorial won't describe them in detail. You'll find links to handy step-by-step guides within this Knowledge Base. You can reference these if you need help.
Add sound and video
First, you'll work with sound and video recordings in Audio-Video.
...
Add each recording to the collection or subcollection.
Add a visualization
Your visualization data needs to be in a Google spreadsheet. This tutorial on creating a timeline walks you through the process. You can also use the Bar Chart guide if you want to create the same graph used in the example. Use Spreadsheet Data might also be helpful.
...
To add a chart, click Add Shivanode from your new collection page. Choose your chart type, then add your spreadsheet url in the "Data Source URL" field. Make sure link sharing is on. See Create a Visualization for more details.
Add texts
Sign in to texts.shanti.virginia.edu, then Add a Collection. Once you have your collection, you can Create Texts. You build texts by creating a main page, then adding section pages to that page. Any new pages can have their own subsections – check out the guide to a text's structure for details.
Add sources
Sign in to sources.shanti.virginia.edu, then Make a Source Collection. You can then Add a Source to start building your bibliography. The "Notes" section is particularly useful if you want to make an annotated bibliography.
2. Create new Knowledge Maps
Knowledge Maps can be subjects (like "parasites" or "cultural landscapes") or places (like "Charlottesville" or "The Rotunda"). Before you decide whether you need new Knowledge Map, go to mandala.shanti.virginia.edu/subjects and mandala.shanti.virginia.edu/places. On each site, click the magnifying glass icon to the right to see the full taxonomy of Knowledge Map terms. The term you need might already be in the database. If so, skip to the next step.
If the term or taxonomy doesn't fit your needs, contact SHANTI at shanti.virginia.edu . A member of SHANTI set up a meeting to discuss your project. Before you meet, consider your needs and the shape of your subject and place ontologies. Go through the existing tree and think about where your terms might fit best, if they fit at all.
3. Label resources with Knowledge Maps
To add a Knowledge Map term, open the resource within its Mandala tool, then click Edit. You'll find a "Place" or "Subject" field in the metadata.
...