Spreadsheet Format
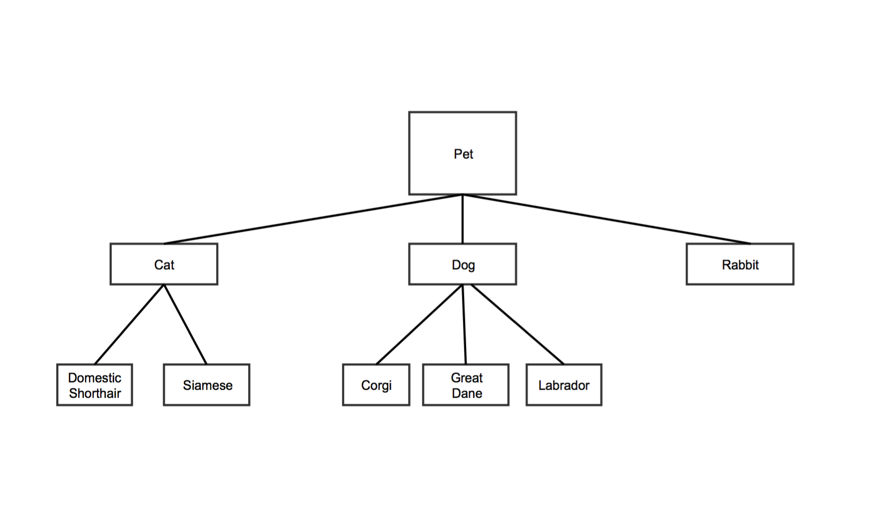
You can build organization charts from tree data structures. Here's a representation of a tree data structure:
Tree data structures are made of nodes, or elements on the tree. In the example above, each box represents a node.
Tree Tree data structures are also hierarchical: each node (or element on the tree) has a parent node. In In the example below, each box represents a node. above, "Pet" is the parent of "Cat," "Dog," and "Rabbit". "Cat" is the parent of "Domestic Shorthair" and "Siamese."
Trees have a root node, which has no parent. "Pet" in the example above is also the root note node, since it has no parent.
You place nodes on the tree using two values: the name of the node, and the name of the node's parent. This is the only relationship that matters when you're building your spreadsheet. For example, you can place the Labrador node with "Labrador" (it's name) and "Dog" (it's parent). Remember, any node on the tree can be a parent.
Each row in the Organization Chart data spreadsheet represents a node on the tree. Learn more about spreadsheets in Visuals at Use Spreadsheet Data.
| Column 1 | Column 2 | |
|---|---|---|
| Data Type | plain text | plain text |
| Contents | The name of the node. Each node must have a unique name. | The name of the node's parent. Note:
|
| Required | x | x |
For the sample tree above, the spreadsheet might look like this:
| Node | Parent |
|---|---|
| Pet | null |
| Cat | Pet |
| Dog | Pet |
| Rabbit | Pet |
| Domestic Shorthair | Cat |
| Siamese | Cat |
| Corgi | Dog |
| Great Dane | Dog |
| Labrador | Dog |
Customization Options
These options are exclusive to organization charts. Go to Common Customization Options for more settings.
Node size
determines the size of nodes on your chart
- choose "large," "medium," or "small"
Allow HTML in nodes?
sets HTML in your nodes to active or inactive
- "True" makes it active
- "False" makes it inactive
Allow node collapse?
controls whether or not a node collapses when a user clicks it, hiding every node below it
- "True" makes nodes collapsible
- "False" keeps nodes stationary
