You build network visualizations using network graphs. Here's a visual representation of a network graph:
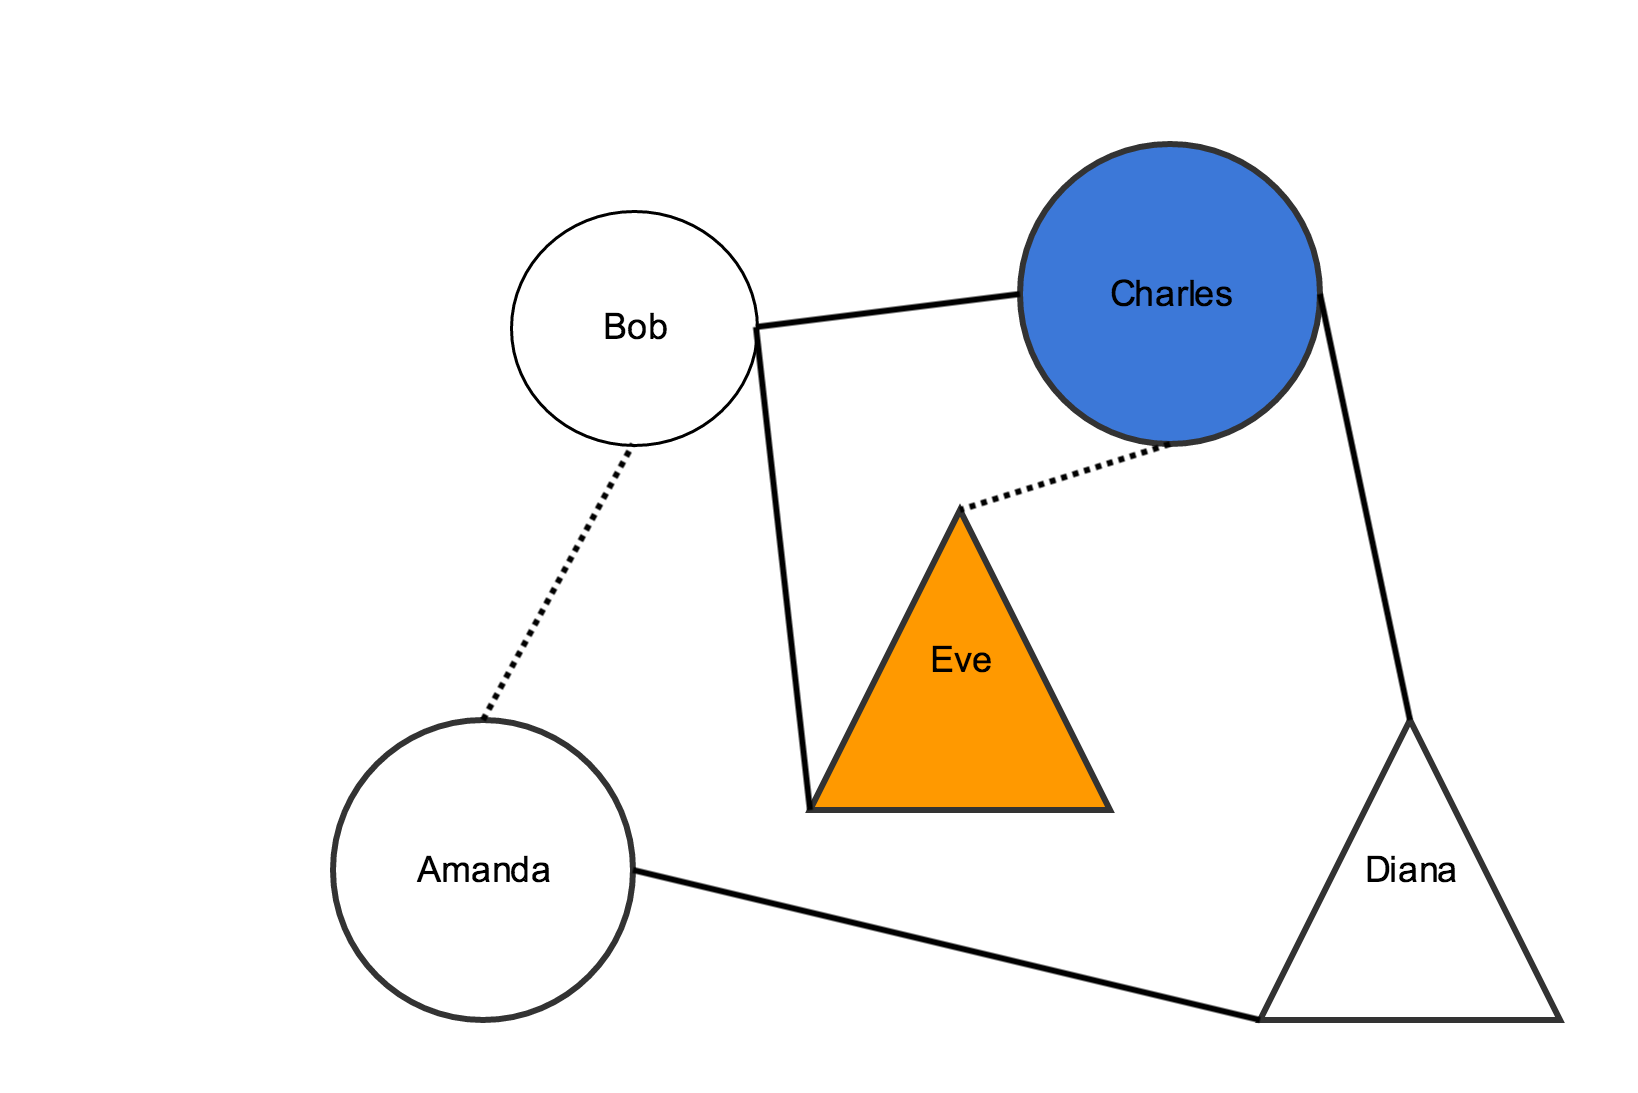
Network graphs are a series of nodes connected by edges or links.
In the example above, the shapes are all nodes. The lines that connect two shapes are links. Nodes and links are components of the graph.
In our example, links and nodes also have different styling. For example, some links are dotted lines, and some are solid lines. Some nodes are circles and some are triangles. In Visualizations, the styling is also a component of your network graph.
Each row in the Network spreadsheet represents a graph component. Row formatting depends on the component type. You can have as many components as you like, as long as they are in one of these categories:
- "node" – places a node
- "link" – places a link
- "class" – styles a node or link by creating a specific styling class, or styling type
You can add components in any order.
To add nodes, make a row with the following data:
Column 1 | Column 2 | Column 3 | Column 4 | Column 5 | |
|---|---|---|---|---|---|
| Data Type | plain text | plain text | plain text | plain text | plain text |
| Contents | "node" Note:
| The id for the node Note:
| The label for the node Note:
| The name of the node's class type. Note:
| Tooltip text for the node Note:
|
To add links that connect two nodes, make a row with the following data:
Column 1 | Column 2 | Column 3 | Column 4 | |
|---|---|---|---|---|
| Data Type | plain text | plain text | plain text | plain text |
| Contents | "link" Note:
| The id for the first node in the relationship Note:
| The class type for the link Note:
| The id for the second node in the relationship Note:
|
To style nodes, make a row with the following data:
Column 1 | Column 2 | Column 3 | Column 4 | |
|---|---|---|---|---|
| Data Type | plain text | plain text | plain text | plain text |
| Contents | "class" Note:
| The name of the class type Note:
| The property name Note:
| The value for the property in Column 3 Note:
|
To style links, make a row with the following data:
Column 1 | Column 2 | Column 3 | Column 4 | |
|---|---|---|---|---|
| Data Type | plain text | plain text | plain text | plain text |
| Contents | "class" Note:
| The name of the class type Note:
| The property name Note:
| The value for the property in Column 3 Note:
|
Appendix
property name | definition | allowed values |
|---|---|---|
| color | The color of the node | Either an RGB color expressed in hexadecimal numbers prefixed with a '#' or one of these color names: blue, red, green |
| alpha | The transparency of the node | A number between 0 and 1, where 1 is maximally opaque |
Link property names and allowed values:
| property name | definition | allowed values |
|---|---|---|
| color | The color of the link | Either an RGB color expressed in hexadecimal numbers prefixed with a '#' or one of these color names: blue, red, green |
| alpha | The transparency of the link | A number between 0 and 1, where 1 is maximally opaque |
Customization Options
Background color: set the background color of your chord graph
- Click the colored square inside the textbox
the ColorPicker tool will appear
- Either: Choose a color by clicking it
- Click Ok
- Or: Click No color
Space for labels: sets the space between chord labels
- Type a number into the textbox
A higher number will result in less space between labels and a smaller overall graph
A lower number will result in more space between labels and a larger overall graph
Width of group band: sets the width of the outer rim of the graph
- Type a number into the textbox
A lower number will result in a thinner band
A higher number will result in a thicker band
Link line width: sets the thickness of the chords
- Type a number into the textbox
A higher number will result in a thicker outline
A lower number will result in a thinner outline
Link colors: sets the color of the links throughout the graph
- Click the colored square inside the textbox
the ColorPicker tool will appear
- Choose a color by clicking it
- Click the squares at the top of the ColorPicker
- Choose a color for each section of the graph
- Click Ok
Fill links: sets whether the chords are filled or outlined in color
- Click the drop-down menu
- Click True to have the chords completely colored in
- Click False to have the chords only outlined in color