If you want to create a timeline:
- Create a Google Spreadsheet
- Format your spreadsheet
- Log in to Visuals
- Connect your Google Drive to Visuals
- Create a new visualization
1. Create a Google Spreadsheet
First, go to docs.google.com. You'll see the Google log in page.

Enter your UVa email, then click Next. Log in with your Netbadge credentials. You'll see the University of Virginia Google Drive page.
Click New, then Google Sheets to make your new spreadsheet.
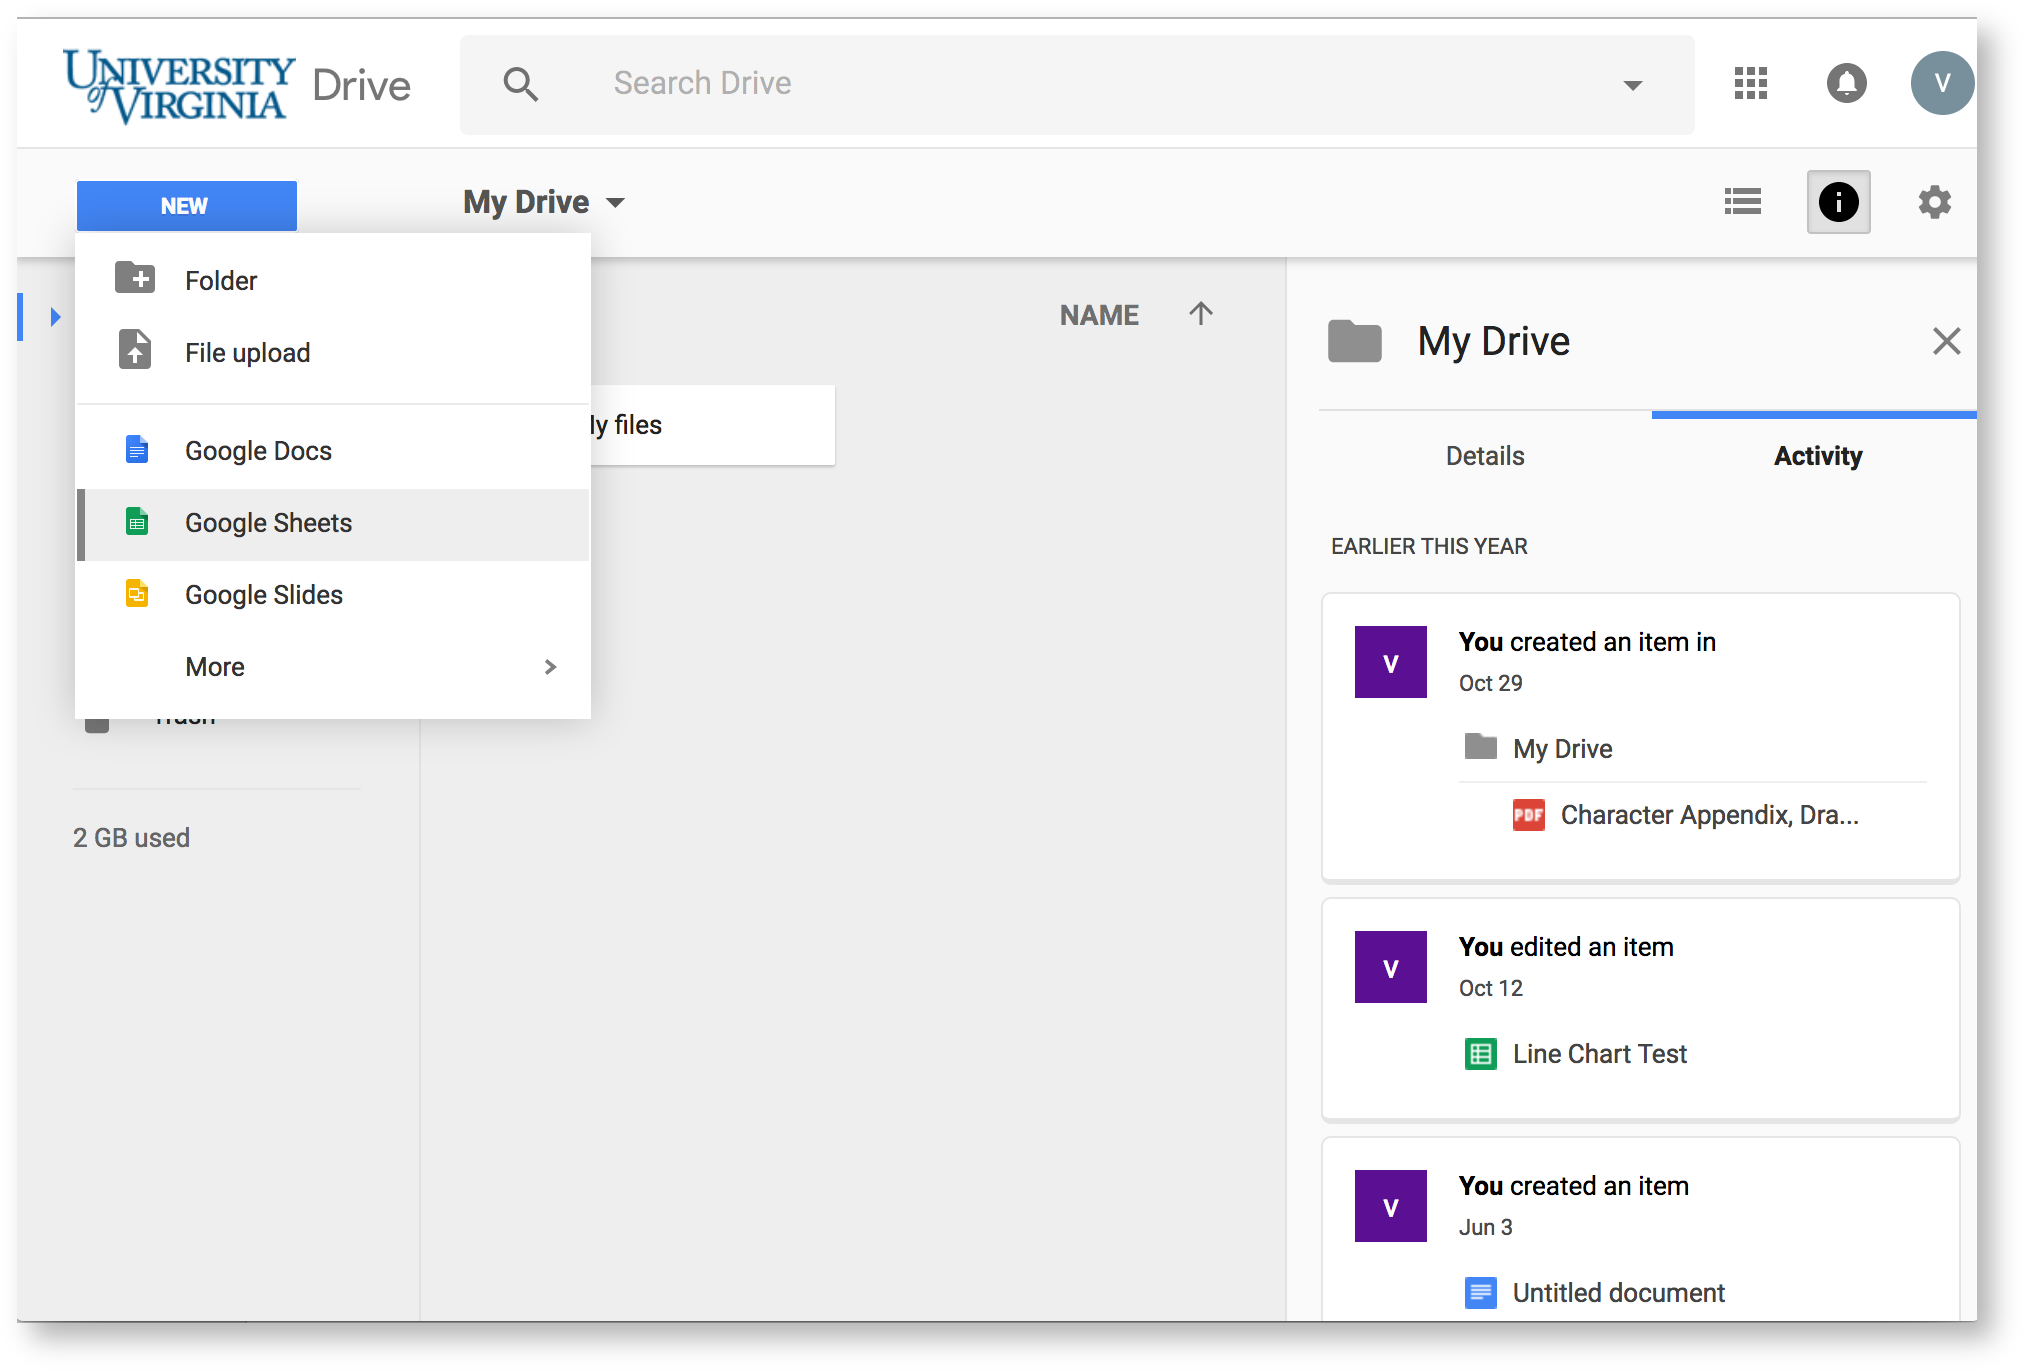
This is where you will enter your data. Before you start that process, however, you should make your spreadsheet accessible to Audio-Video.
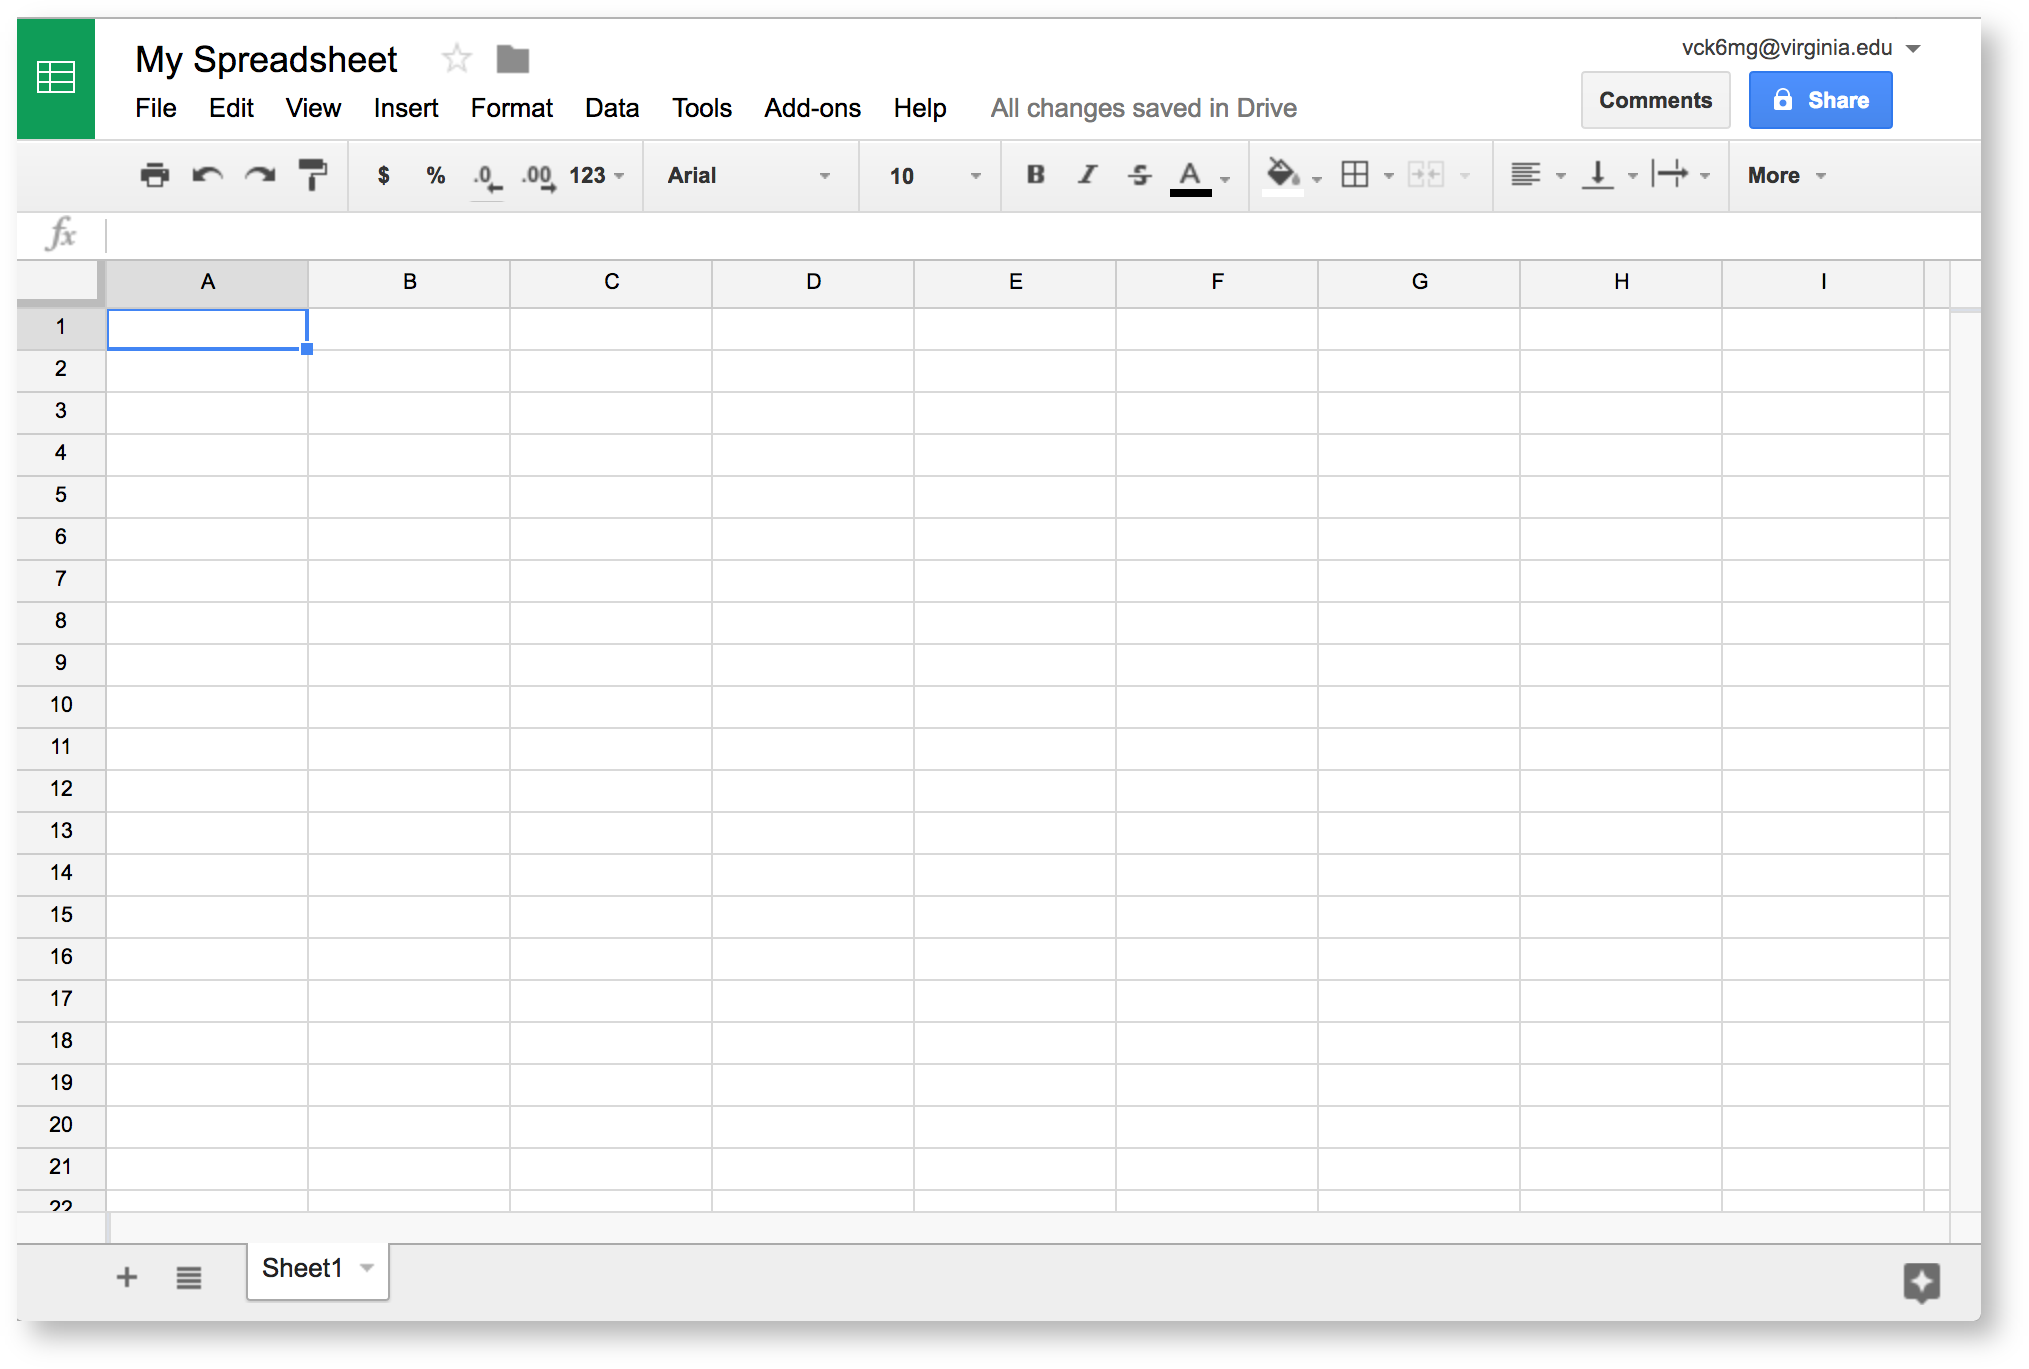
First, Share the spreadsheet in the top right corner of the page. This opens a sharing window.

Then, Get shareable link. This automatically turns on link sharing.
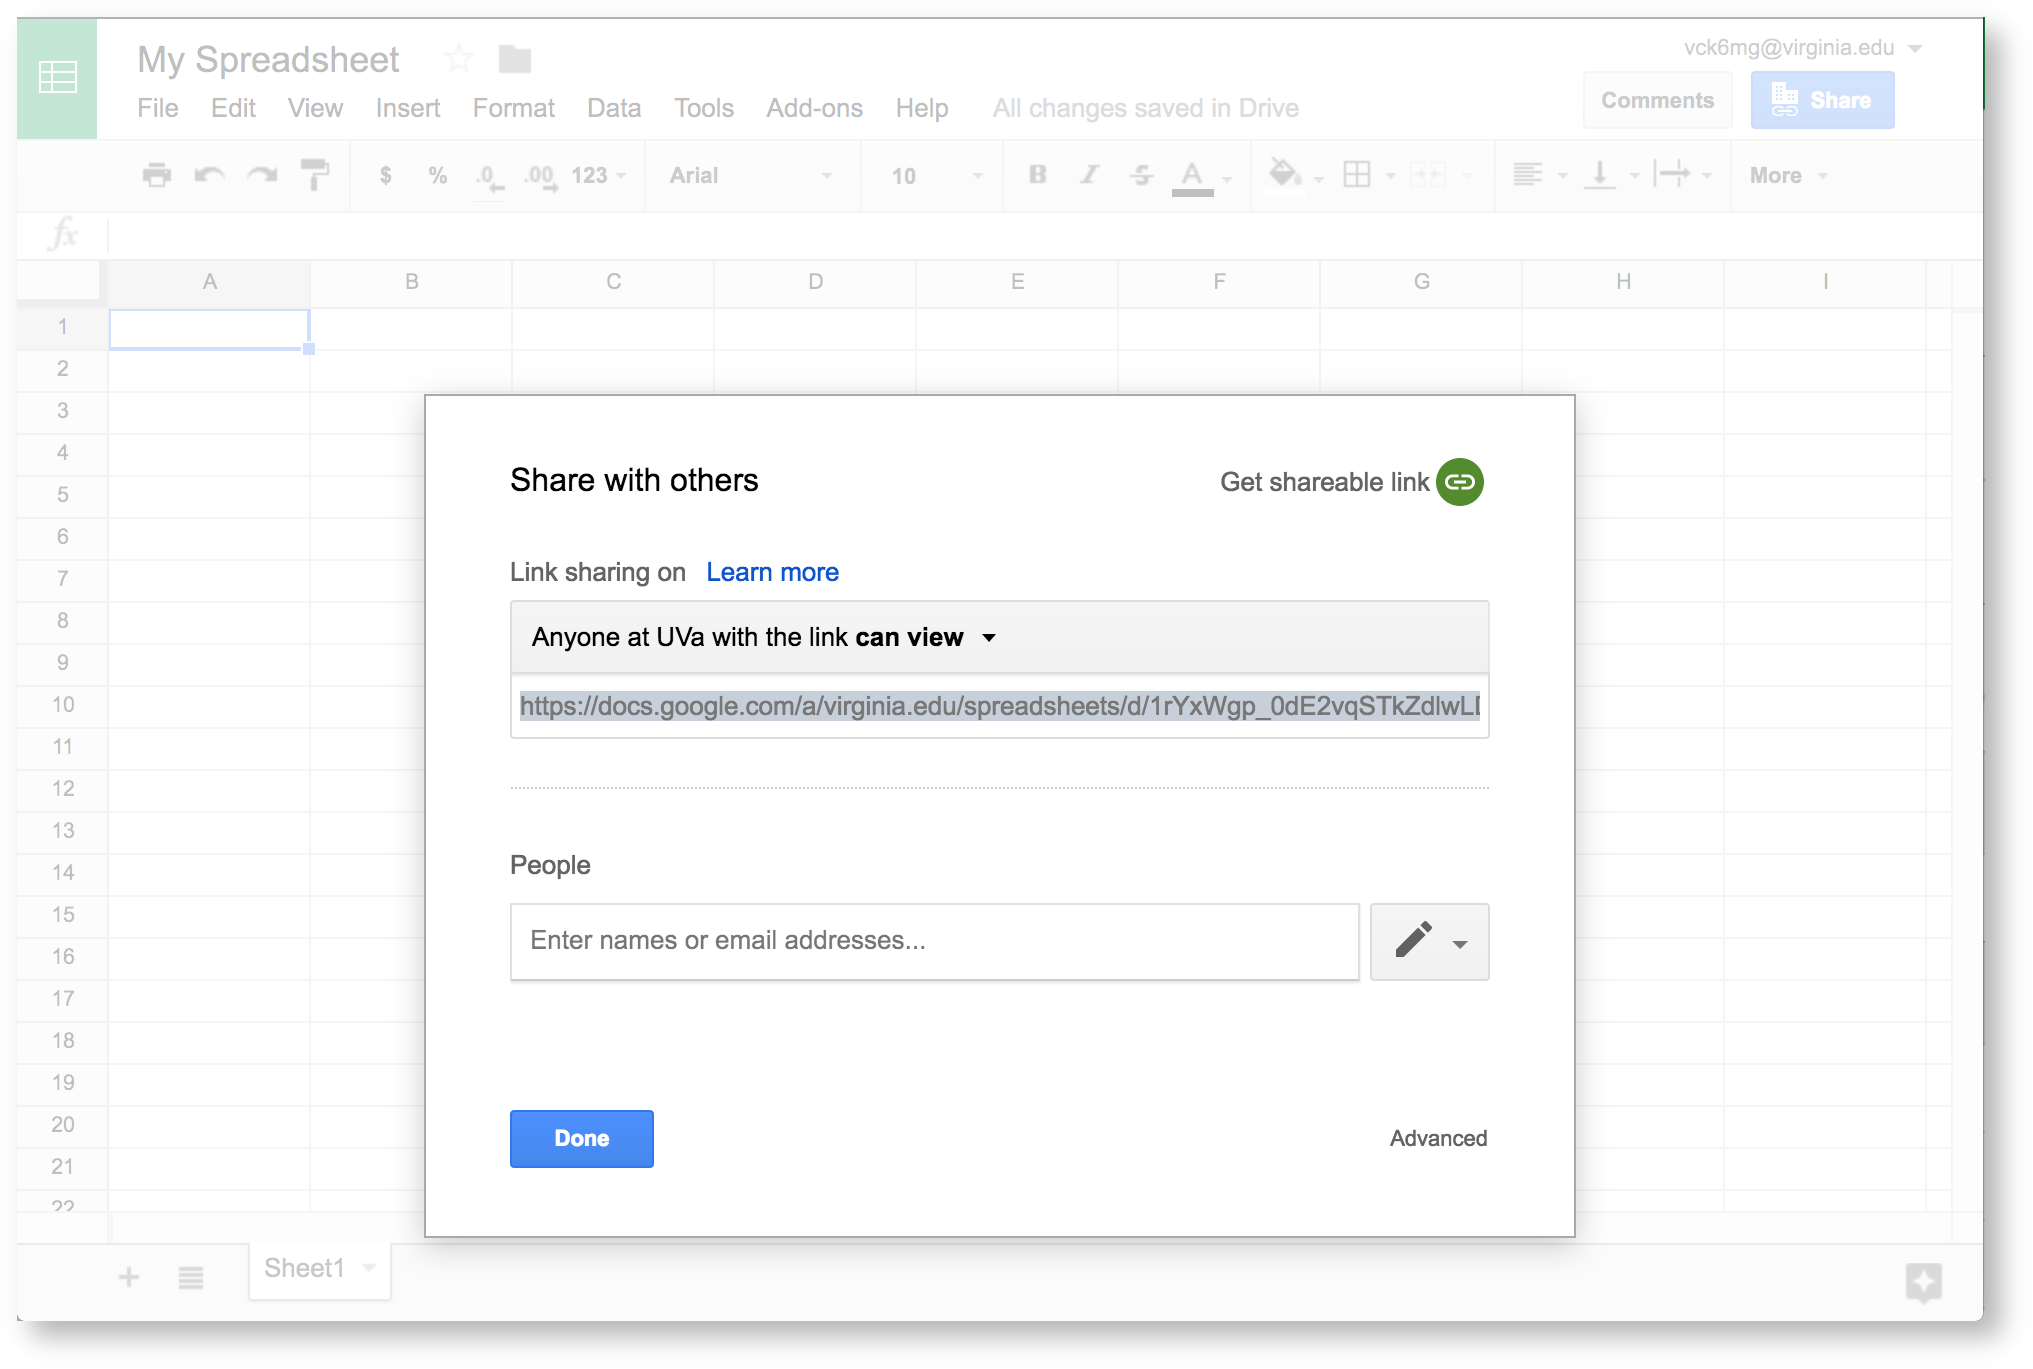
The default setting restricts sharing to UVa viewers. We need to make a few more changes so anyone with a link can access your data.
First, click Anyone at UVa with the link can view. You'll see extra options. Click More to see all privacy options.
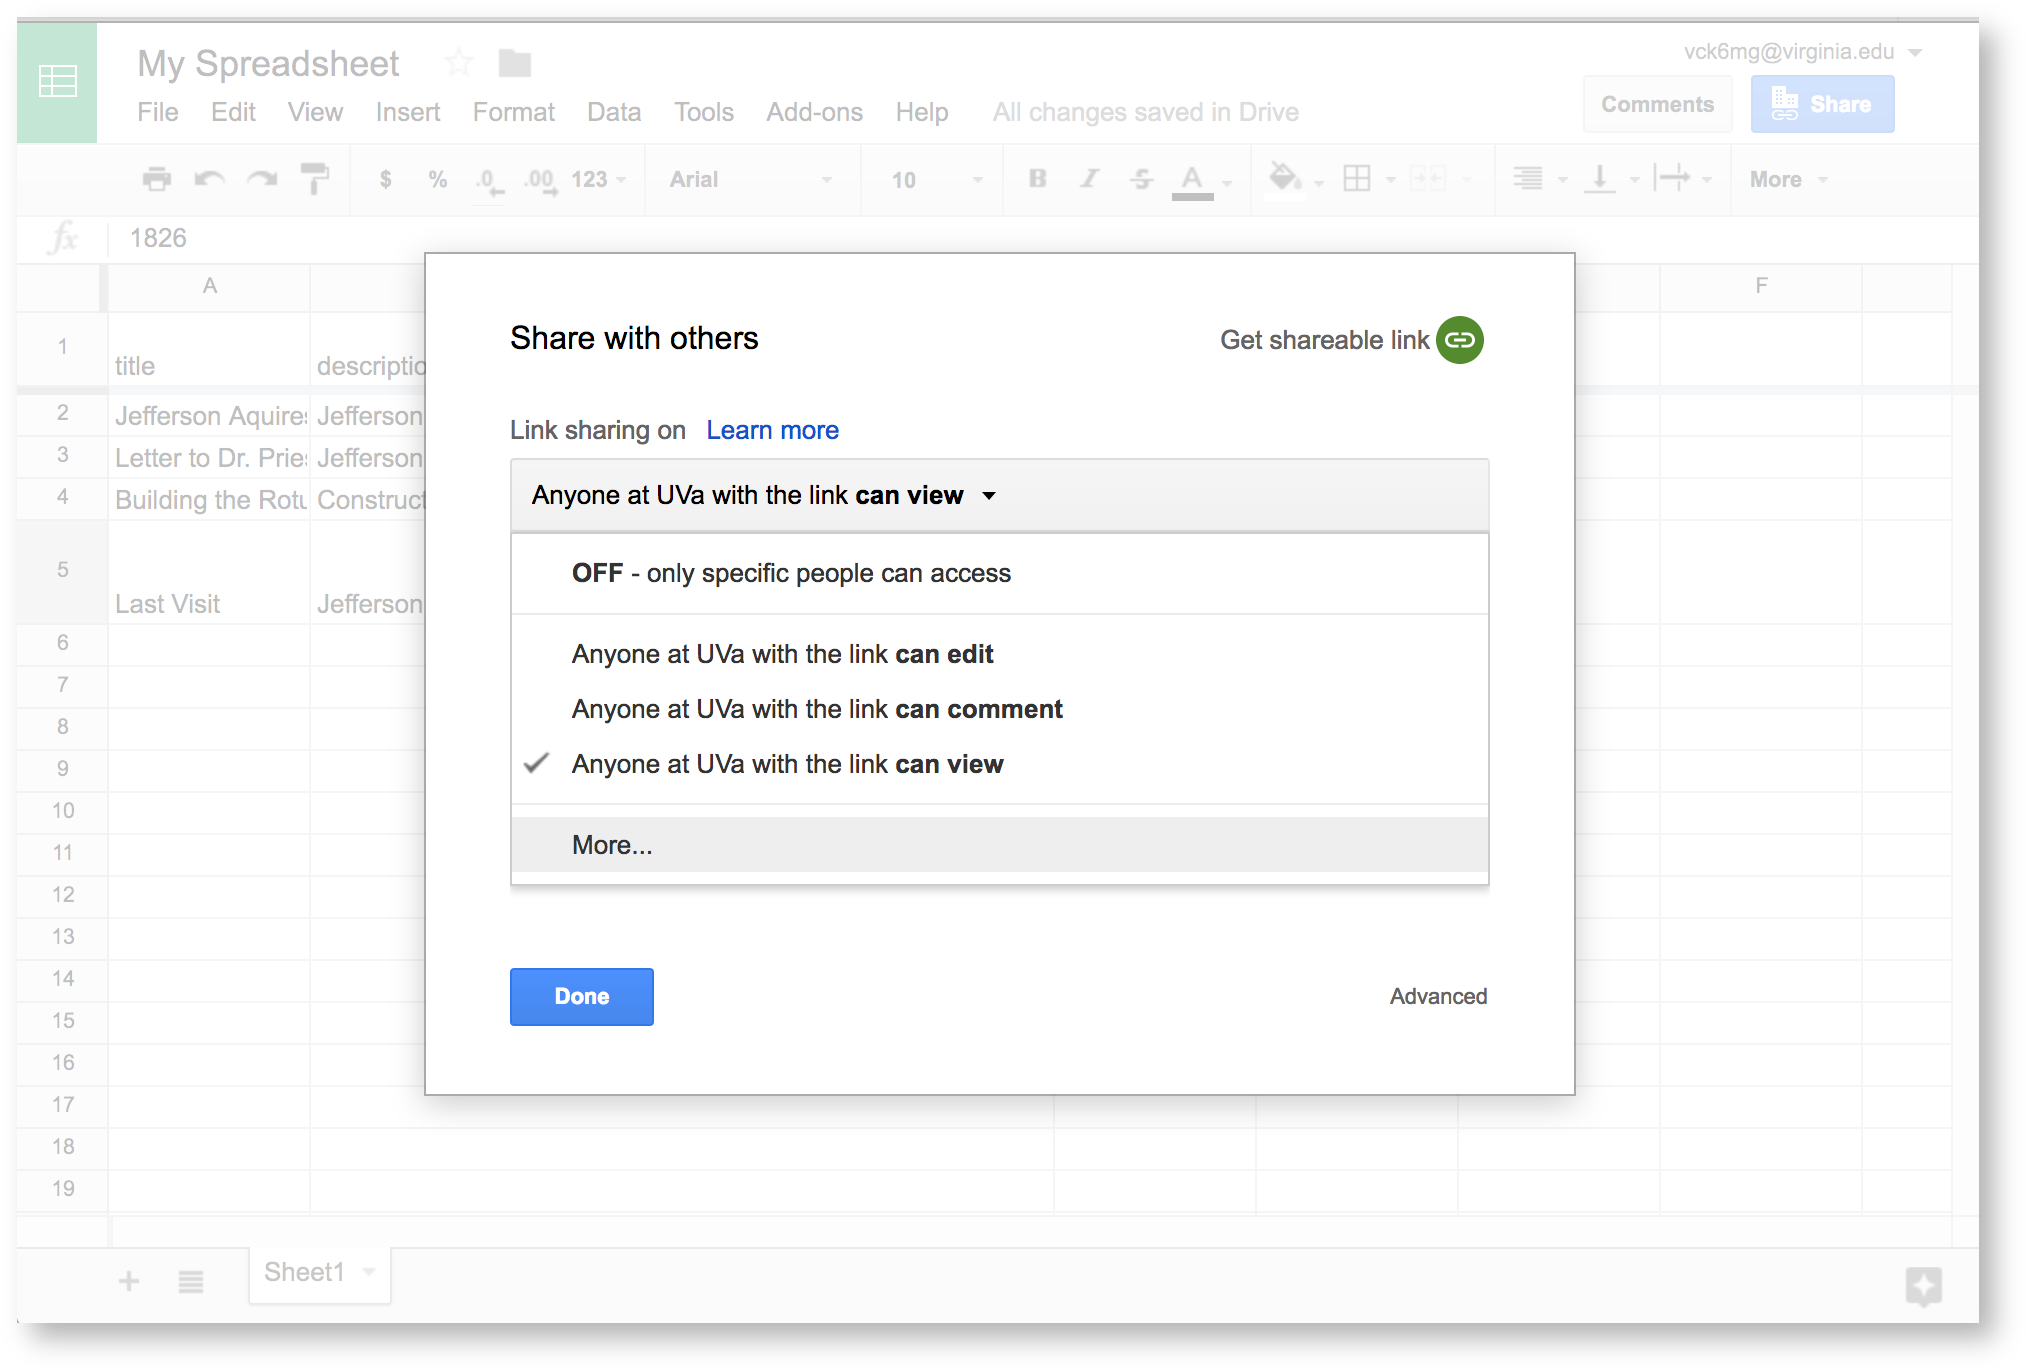
Choose On - Anyone with the link, then Save. Click Done to finish adjusting privacy settings.

Now you're ready to enter your data.
2. Enter your data
At this point, you should pull up our Timeline guide for quick reference. This gives you the specifics for data formatting. In general, you'll use individual chart guides in the Visual index to find out about formatting.
Here, we're making a simple spreadsheet. Enter all required labels at on the top row of the spreadsheet. These are:
- title
- description
- startdate
- enddate
Make sure to copy the names exactly as they're written above.
Now, fill in your data for each cell. You'll see from the Timeline guide that each row represents an event on the timeline. We've entered four events in the example below.
Now that you’ve entered your data, it’s time to format it.
3. Format your spreadsheet
If you pull up our Timeline reference guide, you'll see that the first row you filled out contains data labels. We need to “freeze” this row. This helps Audio-Video read the data you entered.
To freeze the first row, click View in the top menu, then Freeze. Choose 1 row. A grey line will appear under this row.
The Timeline reference guide also has specific data types for each column. Luckily, our example is easy: every column should be in the plain text data type.
To set the data type, select your column. Click Format from the menu, then Number. Choose Plain Text. Do this for each column.
Now your data is ready to go, and you can move to Audio-Video.
4. Log in to visuals
Signing in to Visuals lets you create visualizations.
Go to the external visuals.shanti.virginia.edu. Click on the Main Menu icon () in the top right corner. Then, Log in via Netbadge.
Enter your Netbadge credentials to finish logging in. Now we'll connect your Visuals account to your Google Drive account.
5. Authorize Google Drive access
Before making your timeline, we need Visuals to be able to access your spreadsheet.
From Visuals, click the Main Menu icon ( ), then Account, then Profile. Your account information will appear.
Authorize Now! to give Visuals access to your account.
Audio-Video will confirm that you want to let it access your Drive account. Click Yes. The Google sign in page will open: log in to the account that has your spreadsheet.
Click Allow to finish giving Visuals access. You'll be taken back to the Visuals homepage.
6. Create your timeline
From the Visuals homepage, Create a visualization.
Choose Relationships, then Timeline.
You'll see a list of spreadsheets on your Google Drive. Click Visualize as timeline next to the spreadsheet with your timeline data.
You'll see the visualization editor and a preview of your timeline.
Now we'll use the options in the sidebar to customize your timeline.
The default timeline view doesn't show all the events. Let's fix that.
First, set "Center date of timeline"