You build network visualizations using network graphs. Here's a visual representation of a network graph:
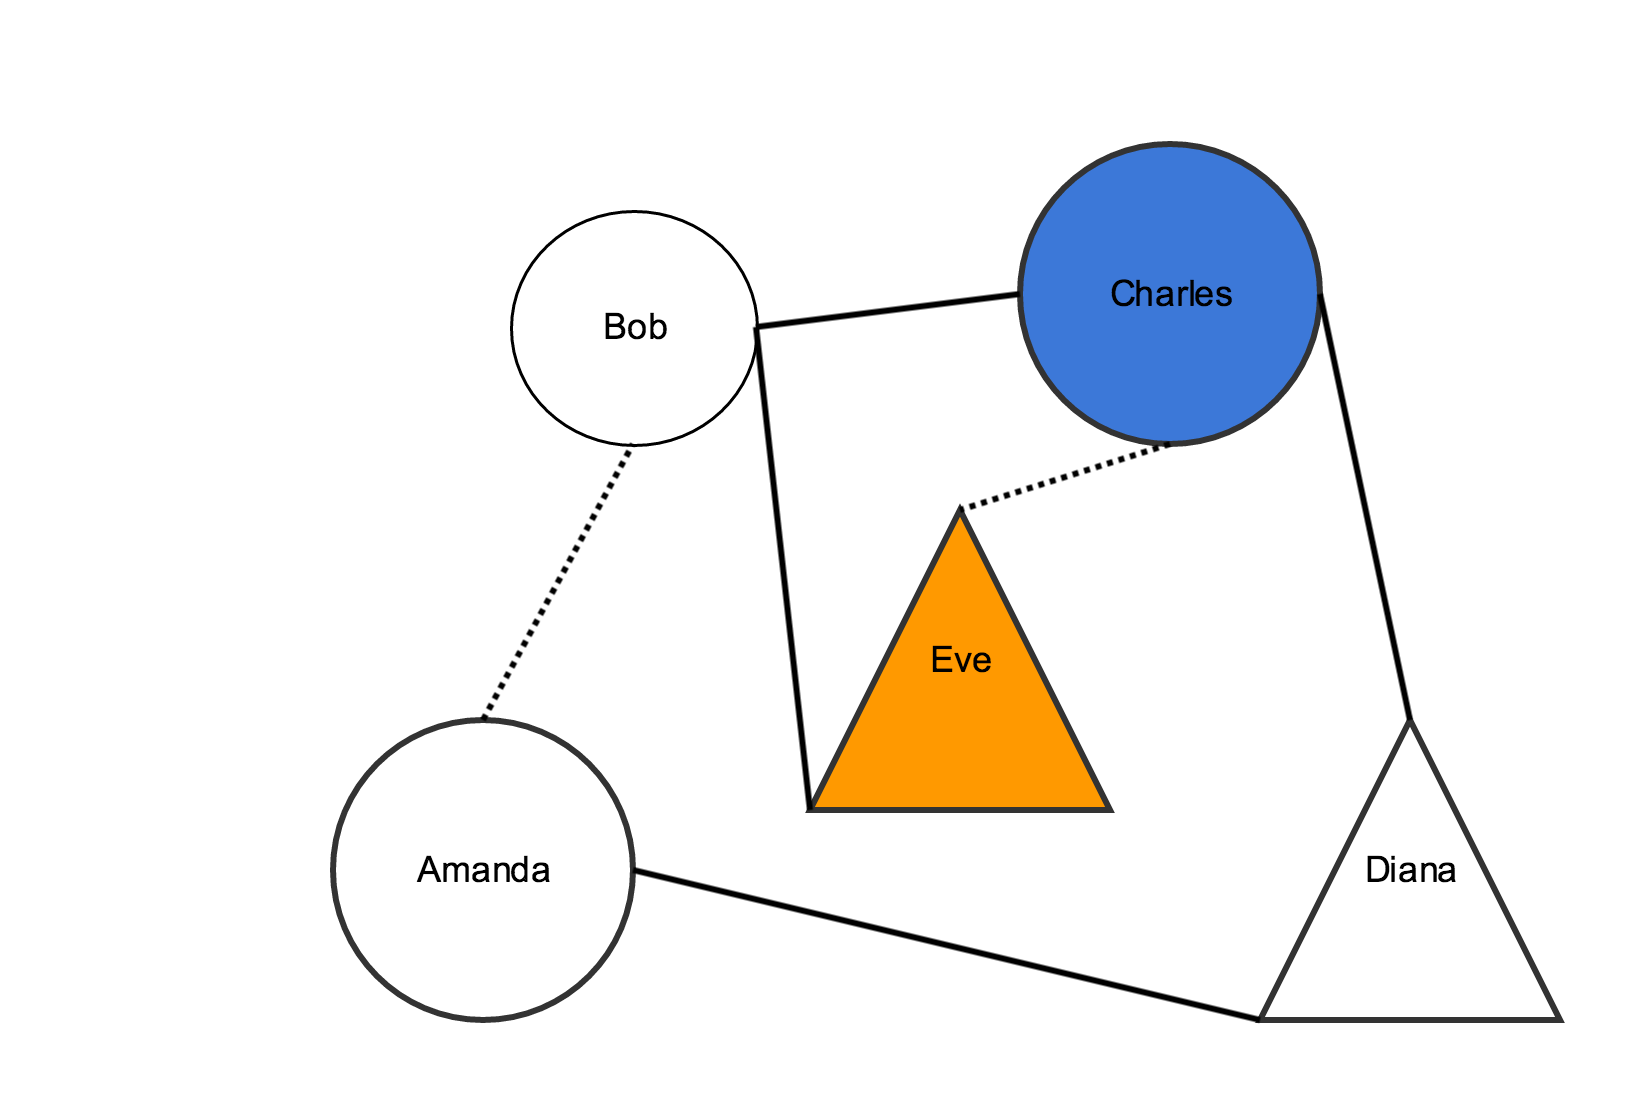
Network graphs are a series of nodes connected by edges or links.
In the example above, the shapes are all nodes. The lines that connect two shapes are links. Nodes and links are components of the graph.
In our example, links and nodes also have different styling. For example, some links are dotted lines, and some are solid lines. Some nodes are circles and some are triangles. In Visualizations, the styling is also a component of your network graph.
Each row in the Network spreadsheet represents a graph component. Row formatting depends on the component type. You can have as many components as you like, as long as they are in one of these categories:
- "node" – places a node
- "link" – places a link
- "class" – styles a node or link by creating a specific styling class, or styling type
You can add components in any order.
To add nodes, make a row with the following data:
| Column 1 | Column 2 | Column 3 | Column 4 | Column 5 | |
|---|---|---|---|---|---|
| Data Type | plain text | plain text | plain text | plain text | plain text |
| Contents | "node" Note:
| The id for the node Note:
| The label for the node Note:
| The name of the node's class type. Note:
| Tooltip text for the node Note:
|
To add links that connect two nodes, make a row with the following data:
| Column 1 | Column 2 | Column 3 | Column 4 | |
|---|---|---|---|---|
| Data Type | plain text | plain text | plain text | plain text |
| Contents | "link" Note:
| The id for the first node in the relationship Note:
| The class type for the link Note:
| The id for the second node in the relationship Note:
|
To style nodes, make a row with the following data:
| Column 1 | Column 2 | Column 3 | Column 4 | |
|---|---|---|---|---|
| Data Type | plain text | plain text | plain text | plain text |
| Contents | "class" Note:
| The name of the class type Note:
| The property name Note:
| The value for the property in Column 3 Note:
|
To style links, make a row with the following data:
| Column 1 | Column 2 | Column 3 | Column 4 | |
|---|---|---|---|---|
| Data Type | plain text | plain text | plain text | plain text |
| Contents | "class" Note:
| The name of the class type Note:
| The property name Note:
| The value for the property in Column 3 Note:
|
Appendix
property name | definition | allowed values |
|---|---|---|
| type | The shape of the node | circle, rectangle, square, ellipse, triangle, star |
| color | The color of the node | Either an RGB color expressed in hexadecimal numbers prefixed with a '#' or one of these color names: blue, red, green |
| dim | The size of the node in pixels. Specifically, the radius of a circle, half the length of the side of a square, half the base and half the height of a triangle or the length of a side of a star. | A number |
| alpha | The transparency of the node | A number between 0 and 1, where 1 is maximally opaque |
Link property names and allowed values:
property name | definition | allowed values |
|---|---|---|
| type | The style of line | arrow, line |
| lineWidth | The width of the link in pixels | A number |
| color | The color of the link | Either an RGB color expressed in hexadecimal numbers prefixed with a '#' or one of these color names: blue, red, green |
| alpha | The transparency of the link | A number between 0 and 1, where 1 is maximally opaque |
Customization Options
Go to Common Options for Charts and Graphs to see the rest of the options
Height: determines the height of the graph
- Type in a number
Width: determines the width of the graph
- Type in a number
Node distance: determines the distance between the nodes
- Type in a number to set the distance
- Note that a larger number will spread the nodes farther apart
Node charge
- Either: Type in positive number to have the nodes be attracted to each other
- Use this option if you want to clearly see each node because they will be spread apart
- Or: Type in a negative number to have the nodes be repulsed by each other
- Use this option if you want nodes with closer data points to overlap
Node gravity: controls the distance the nodes appear from the center of the graph
- Type in a higher number to have the nodes move closer to the center
- Type in a lower number to have the nodes move farther from the center
Node strength: controls the length of the links
- Type in a number between 0 and 100
- Note that a higher number makes longer links
Node shape: sets the shape of the nodes
- Choose from a list of shapes in the drop-down menu
Popup show time: controls how many seconds a pop-up dialogue box will be visible
- Type in a number
Node size: controls the radius or height of the nodes
- Type in a higher number to create larger nodes or a lower number to create smaller nodes
Node color: sets the color a node will have if there are hidden nodes
- Click the colored square to show the ColorPicker tool
- Choose a color