You build network visualizations using network graphs. Here's a visual representation of a network graph:
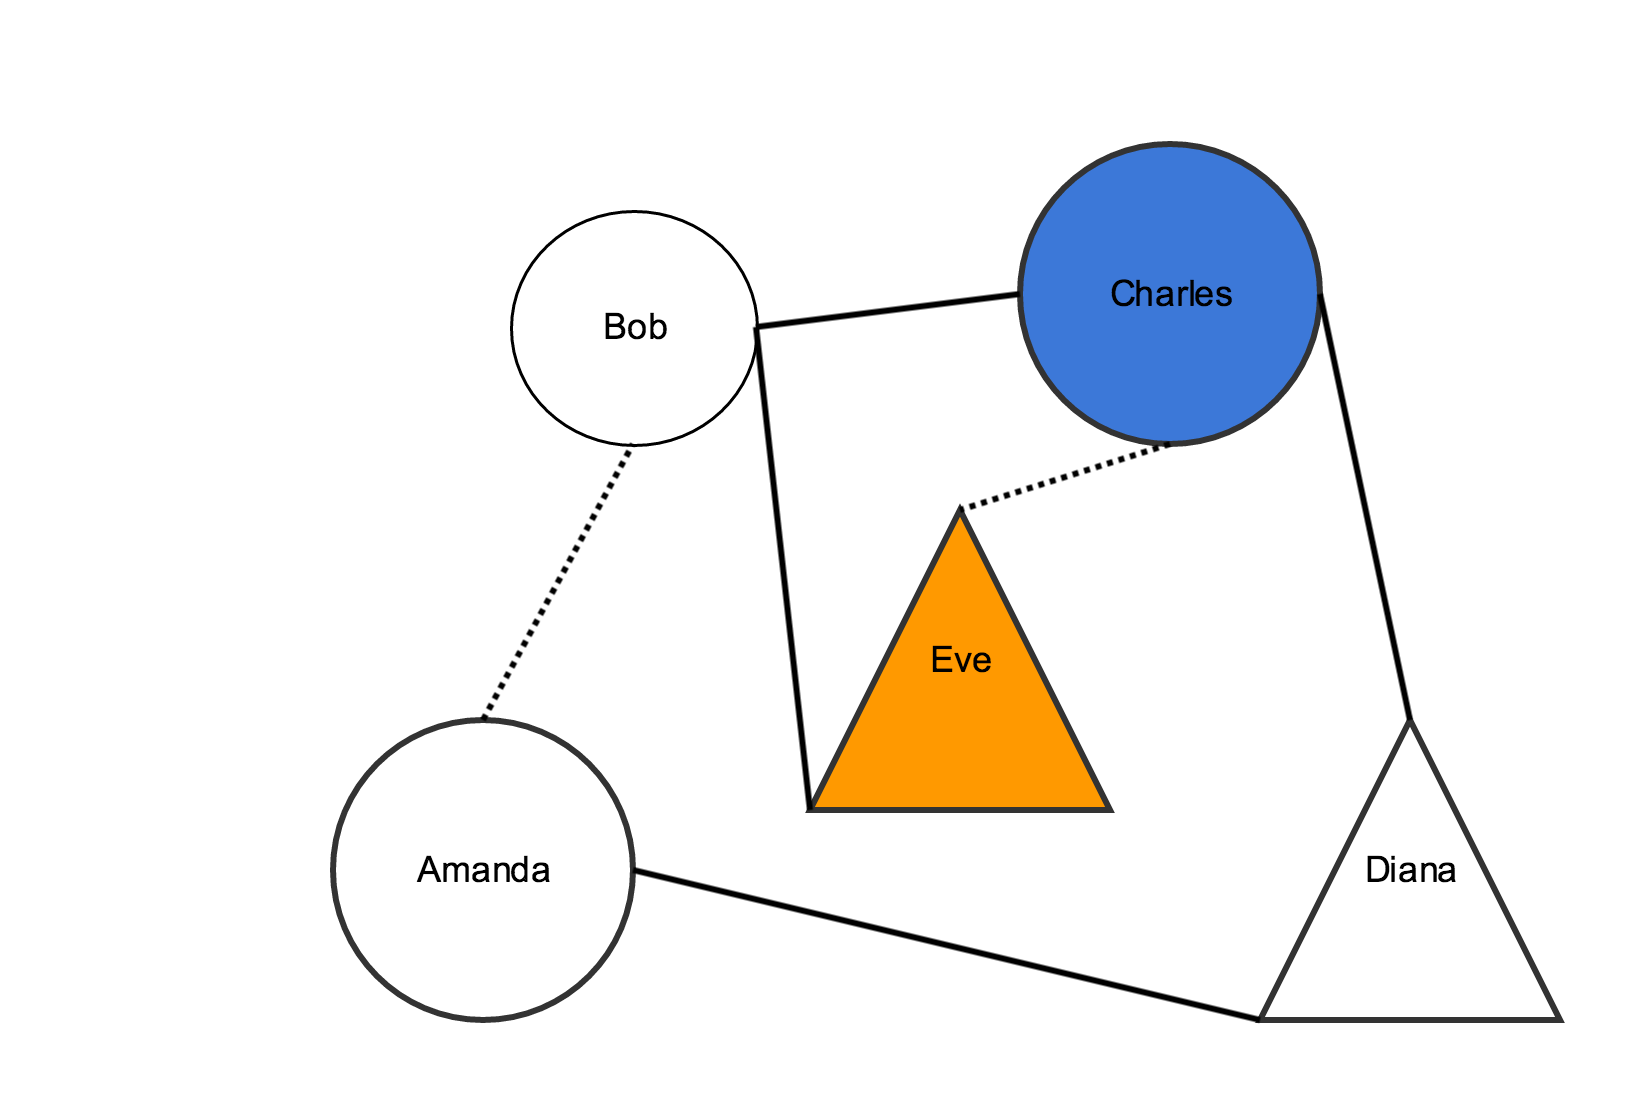
Network graphs are a series of nodes connected by edges or links.
In the example above, the shapes are all nodes. The lines that connect two shapes are links. Nodes and links are components of the graph.
In our example, links and nodes also have different styling. For example, some links are dotted lines, and some are solid lines. Some nodes are circles and some are triangles. In Visualizations, the styling is also a component of your network graph.
Each row in the Network spreadsheet represents a graph component. Row formatting depends on the component type. You can have as many components as you like, as long as they are in one of these categories:
- "node" – places a node
- "link" – places a link
- "node-class" – styles a node
- "link-class" – styles a link
To add nodes:
| Column 1 | Column 2 | Column 3 | Column 4 | Column 5 | |
|---|---|---|---|---|---|
| Data Type | plain text | plain text | plain text | plain text | plain text |
| Contents | "node" Note:
| The id for the node Note:
| The label for the node Note:
| The node's class type. Note:
| Tooltip text for the node Note:
|
To add links that connect two nodes:
| Column 1 | Column 2 | Column 3 | Column 4 | |
|---|---|---|---|---|
| Data Type | plain text | plain text | plain text | plain text |
| Contents | "link" Note:
| The id for the first node in the relationship Note:
| The class type for the link Note:
| The id for the second node in the relationship Note:
|
To style a node:
To style a link: