Introduction
In order to control the amount of liquid helium in the system at any given moment, a user interface with the platform LabVIEW is needed. The level of liquid helium is controlled by the position of the run valve, which allows it to flow from the separator to the nose (for more information on this process, follow THIS LINK and find Low Temperature: Cryogenics). The run valve has can have any position between 0 and 3 "turns", with 0 turns being completely closed and 3 turns being completely opened. LabVIEW is used to provide a means of automatically measuring and responding to the helium level inside the tank. This is done by running two separate Virtual Instruments in unison, a Measuring VI and a Response VI.
- The Response VI controls the run valve position. It reads the current level from the Measuring VI, and reacts in order to ensure that the level stays near a user-specified target level. This is the larger of the two VIs and it interacts with the instrumentation involved, like the run valve itself. It can be run in a setting without LHe (in which it would use the Measuring VI to act as a level probe) or with LHe (in which an actual level probe would be measuring the amount of LHe in the helium reservoir in the nose and feeding that information into the Response VI). If you need to know how to test in either of these environments, links to instructions can be found in the table of contents above.

- The Measuring VI uses a predetermined flow rate equation to estimate the current level of the tank based on the valve position. It takes into account randomness of flow and a constant rate of evaporation. This VI is used for testing the Response VI when it is not yet ready to risk testing with LHe.
Measuring VI
Interface
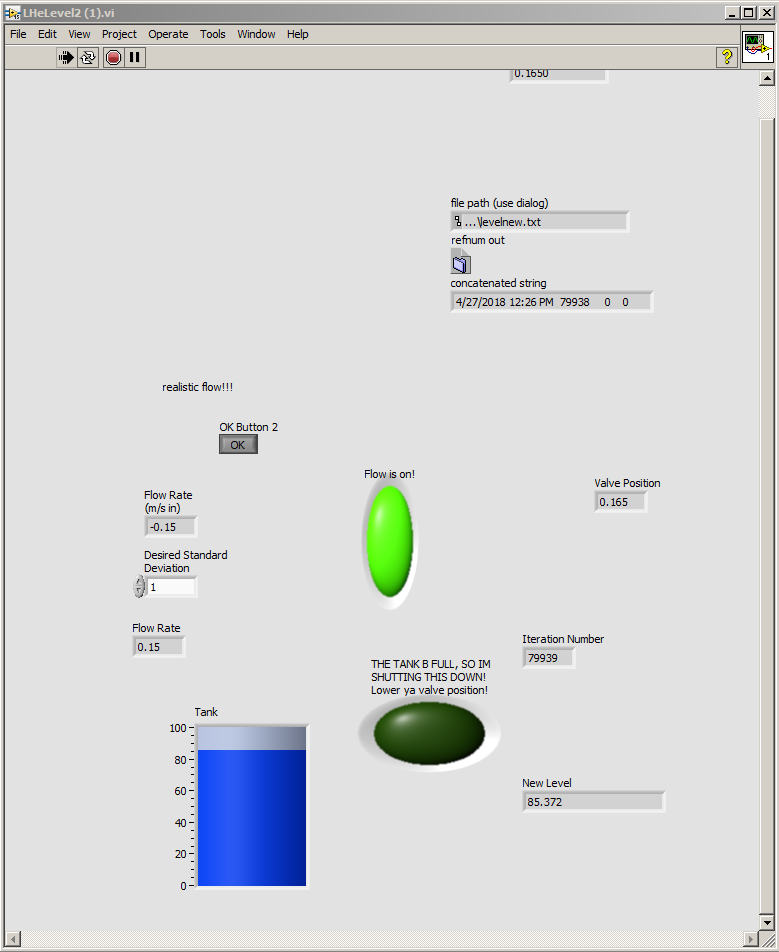
When the VI is first opens up, the first panel to appear is the interface. This panel is where you can comprehensively see how full the tank is at any given moment, and can change a few control factors of the code.
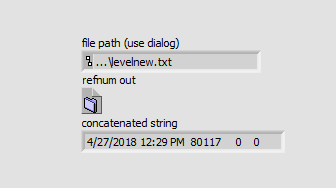
One of the controls that will need to be set before the VI can run is the file path (see below). You should set this to a location on your computer's hard drive.
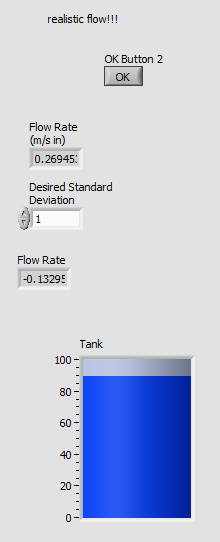
Next, you will need to set the standard deviation of the flow rate randomness curve. In order to provide a more realistic measurement of the level, randomness was introduced into the flow rate equation to account for small variations in flow. In order to keep this variation realistic, you shouldn't set the standard deviation anything higher than 1. Also included in the interface are indicators for certain values pertaining to the system at that iteration. For instance, above the standard deviation control there is a "theoretical flow rate" indicator, (in other words, the flow rate calculated before randomness was applied) and below it there is a "realistic flow rate" indicator (the flow rate with randomness taken into account). The blue tank is comprehensive indicator for the level at each iteration. It is measured in percentages of 0 - 100 % full.
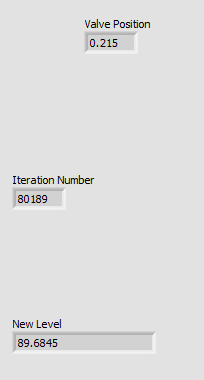
To the right of this section of the interface there are indicators for the current valve position, the current iteration number and the new level as calculated by the VI. These values are calculated every 1 second (the length of time of one iteration of the code).
Code
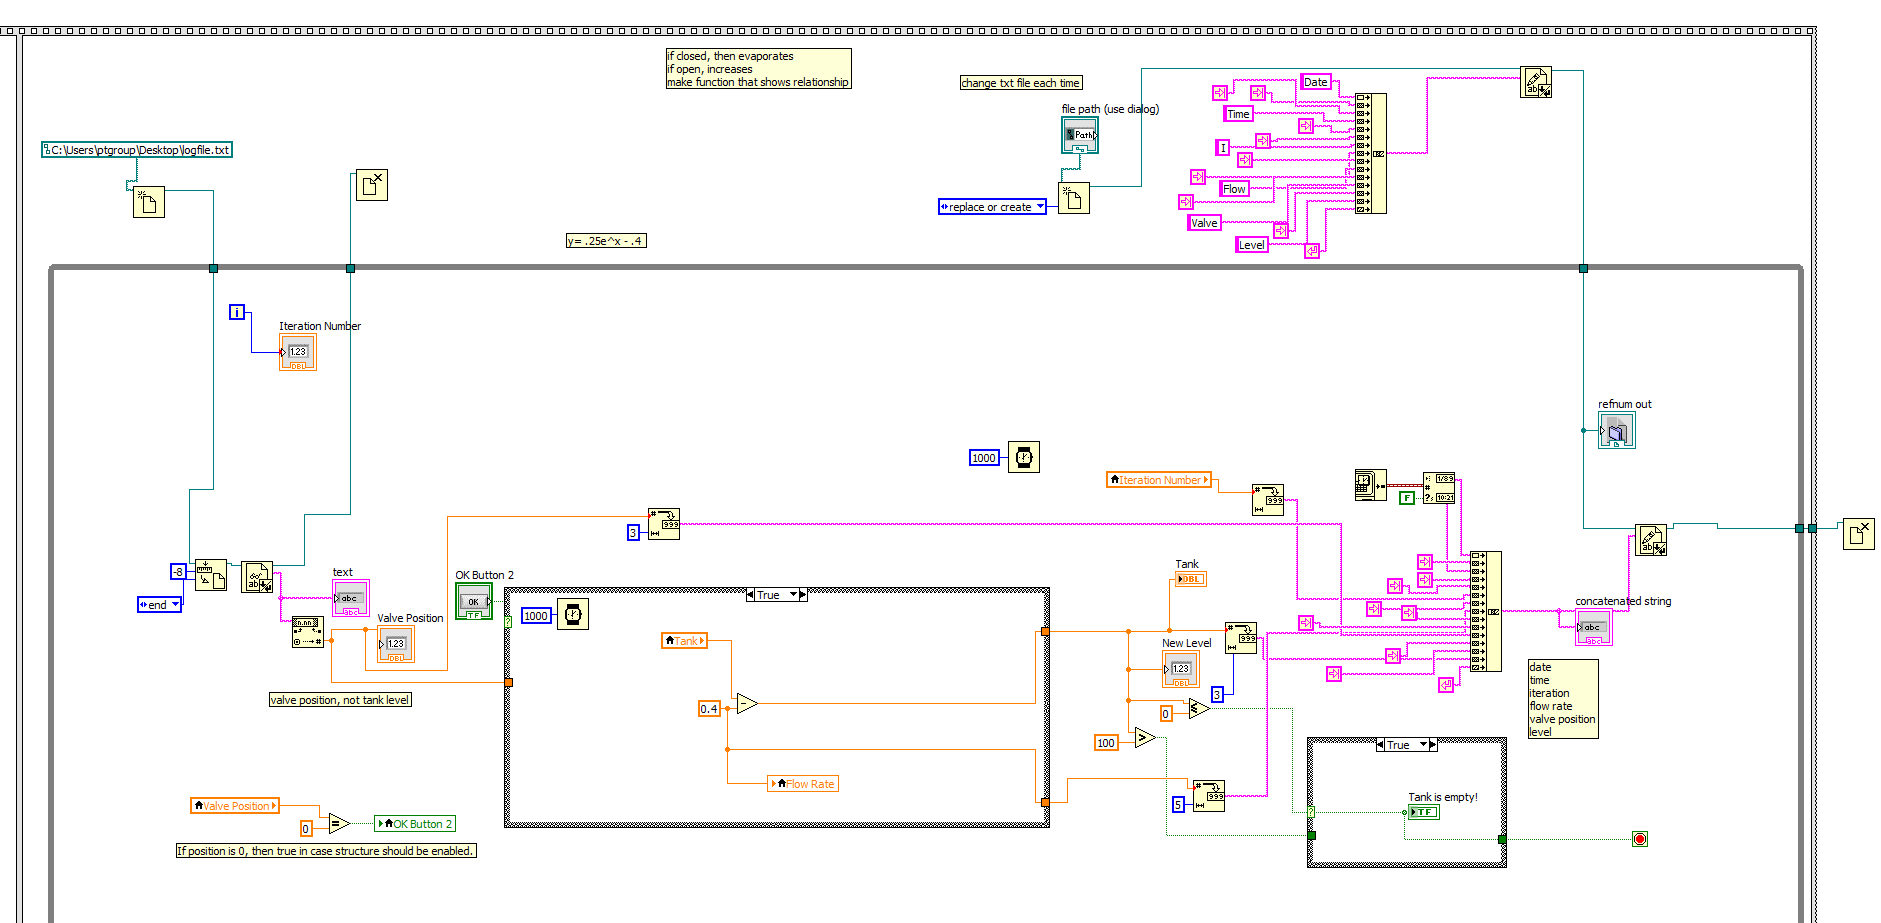
The Measuring VI code uses the reading of the valve position from the Response VI (which will be described later in this link), creates an equation for flow rate (using an exponential equation which can be edited by the user) and uses that position to change the level in the "tank".
Of the two VIs, it is the smaller one and does not connect to machinery, its only role in the system is to interact with the Response VI. Some of the data as far as the flow rate equation may need to be edited according to differing experimental constants for liquid helium. The constants used in the equation below are NOT ACCURATE.
The First Half of the Sequence Structure

The first half of the sequence structure contains the number the level of the tank is initially set to (here, it is level 10, or 10% of the way full) and this sequence is set to wait one second before starting the next part of the VI. The initial number is arbitrary as long is it doesn't reflect a certain initial level in the tank that is known to the user (for instance, if you want the tank to be empty when the program first starts running, then you should set the initial level of the tank to zero).
The Second Half of the Sequence Structure
The second half of the sequence structure contains the main part of the VI, and works in steps to measure the level. These steps include reading the incoming Response VI file, identifying the flow rate, changing the level and writing to the new text file.
Incoming File IO
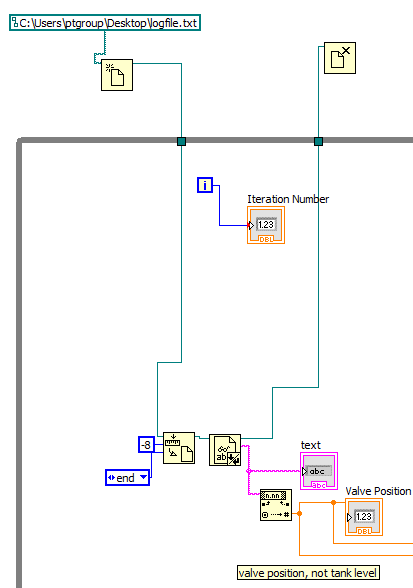
In order to read the valve position for a specific iteration, it must be read into the Measuring VI through a text file. The file that contains the valve position data must be accessed, and it is opened outside the while loop in order to keep the VI running as smoothly as possible (when the file is opened inside the while loop with each iteration, the VIs tend to communicate slower and therefore do not have as long of a run time). When the file is accessed, it takes the last 8 characters from the txt file, which include the width of the number string itself and two end of file characters. The width must be carefully looked at before running, as it is sometimes difficult to get the correct one. If you are receiving an error about how one of the characters is unrecognizable, then it is likely that the width is off. Also, if you check and see while the VIs are running that the valve positions displayed in both VIs do not match, the same issue is present and the width should be altered.
Once the correct valve position string is recorded, it should be converted into a usable number so it can be used in the equations to follow. Finally, the file should be closed when the loop has completed, preferably outside the loop as to not slow things down, but if you want to be able to access the data easier while its running then you can put it back inside the loop.
Flow Rate Equation and Randomness
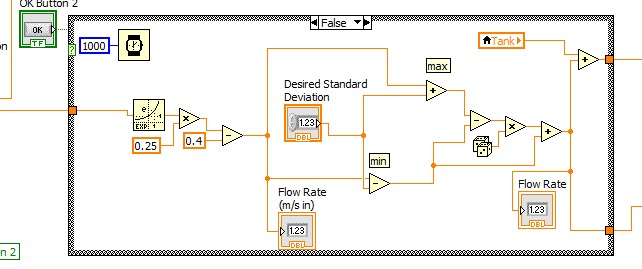
While any equation would work, the equation in place (while the valve is open) for the flow rate is y = 1/4*ex - 2/5, where y is the flow rate in m/s and x is the valve position in turns. 1/4 was chosen as a constant coefficient for leveling out how much the flow increases, and 2/5 is the constant rate of evaporation of the liquid helium.
After this equation is performed in LABView, the randomness generator changes the flow rate from the theoretical to a more realistic one, in order to account for viscosity or variations in amounts, etc.The randomness generator uses a standard deviation to return a number that is around the theoretical flow rate, where the average of all the flow rates for each iteration is close to the theoretical.
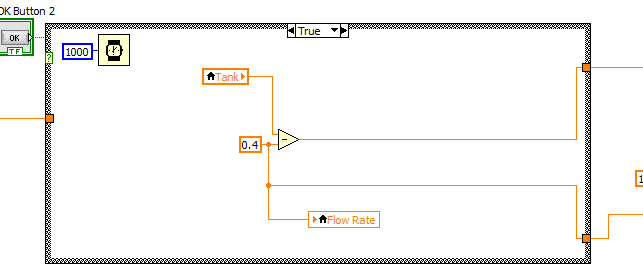
Note that the when the valve is closed, the case structure is activated and the level decreases at a constant rate of .4 m/s.
Changing the Level
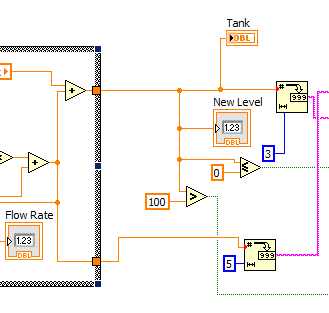
Once the realistic flow rate has been calculated, it is used to change the level of the tank for that iteration. Since the flow rate is calculated in units of m/s, and the time that each iteration lasts is 1 second, the value for flow rate is the same as the amount change of the level for that iteration. This number is then added to the last level of the tank, to become the new level. The new level is then written to the tank, and is also constantly checked to ensure that it is not too high or too low. For instance, if the value becomes less than or equal to zero, the VI stops as the tank is empty. Likewise, if the level is greater than 100, the VI shuts down completely and the level stops changing.
Text File Assembly
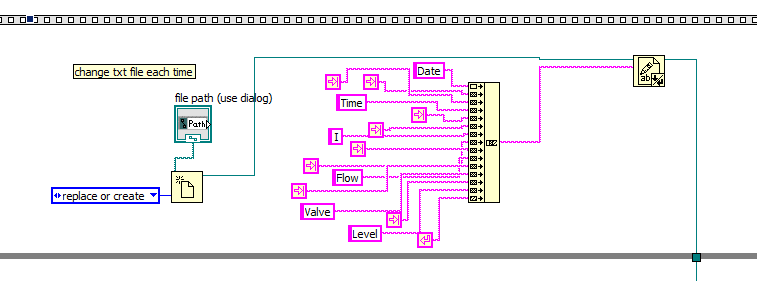
Lastly, the text file assembly conveys the data recorded by the Measuring VI into a clear and concise file. At the top of the VI, the text file heading is assembled to indicate the Date, Time, Iteration, Flow Rate, Valve Position and Level. These indicators are collected into a string concatenator and seperated by tabs, and finally followed by a return carriage, which basically enters data into the following line.
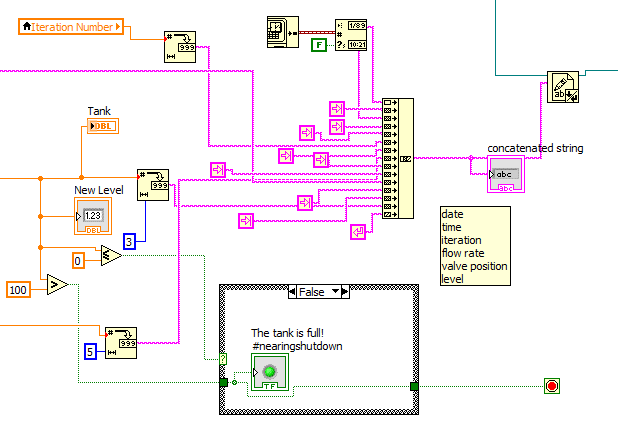
Also a part of the text file assembly is the actual collection of the data from the VI. First, the time stamp is recorded and then converted into a string to fill the first two "columns" of data. Next, the iteration number is taken, converted into a string, and fills the third. Then the flow rate is recorded into the fourth column, followed by the valve position, which makes up the fifth. Finally, the new level is recorded into the last column after being converted into a string.
Once the text file has been created and written, and the VI is done running, the text file is closed outside of the loop. It is possible to open the text file while it is still running, but it will only contain the data up to the time you opened it, and will not keep updating while open.
Response VI:
Interface
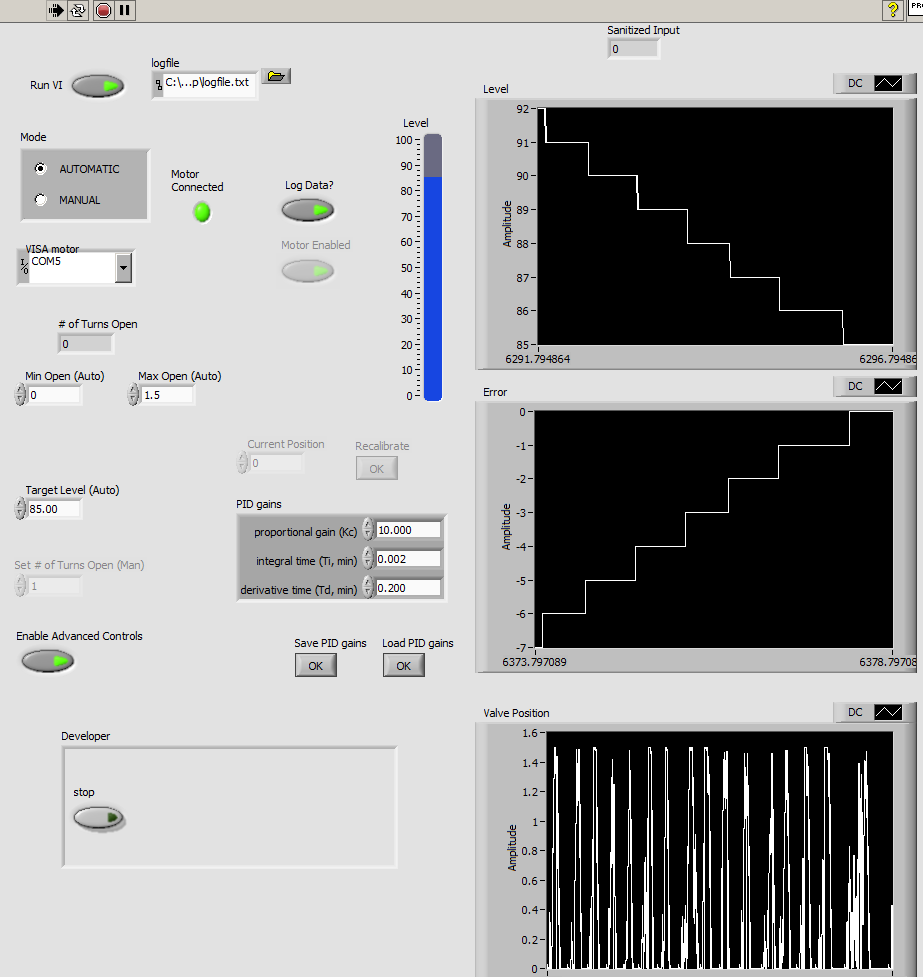
This is an example of what the Response VI Interface will look like when first opened.

In the top left hand corner of the interface is run VI icon, and next to it is the text filepath which the user can set. Below is the option for automatic mode (when the VI itself changes the valve position with each iteration) or manual mode (where the user has to specify the exact valve position at any given instance), the boolean indicator for whether the VI and motor are connected properly, and another icon to select when you would like the valve position data to be saved into the text file. Still below that is the indicator for which COMPort the VI is connected to and the valve position indicator. Finally, there are control values for the minimum valve position and maximum valve position that the user desires for that particular test or trial.
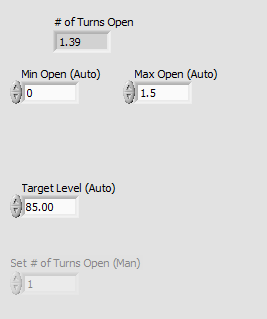
In the middle left of the interface is the control for the target level, which is the level of the tank, set by the user, that the Response VI tries to maintain throughout the trial. Also, if manual mode was selected, the user would have to set the number of turns open in a control located below the target level (in the image above, the VI is running in automatic mode, and so this icon is grayed out. If it were in manual, it would be clear and the target level control would be grayed out instead).
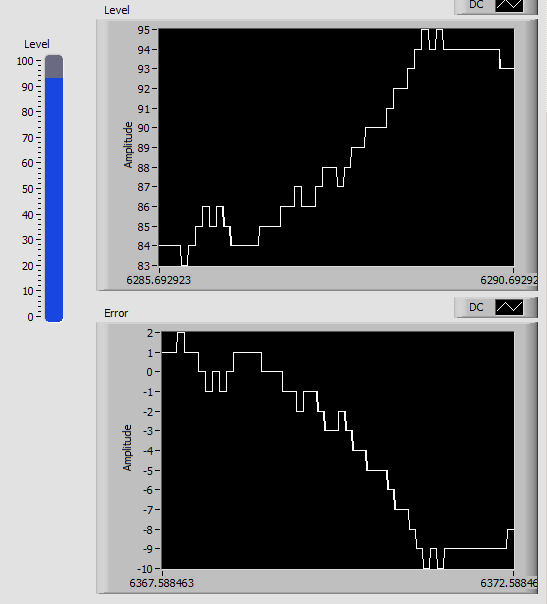
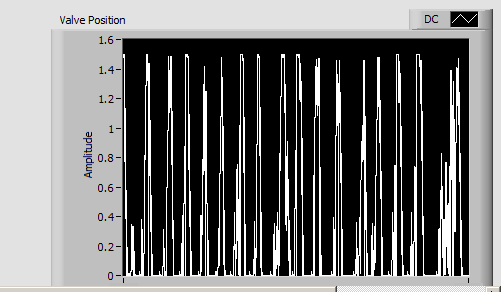
The two images above display the three graphs found in the interface, which from top to bottom, respectively, show the level (in other words, the fullness of the tank at that iteration), error (from the target level) and valve position with respect to time. Next to the level graph is an indicator for the current level at that iteration, based on a percentage of 0-100%.
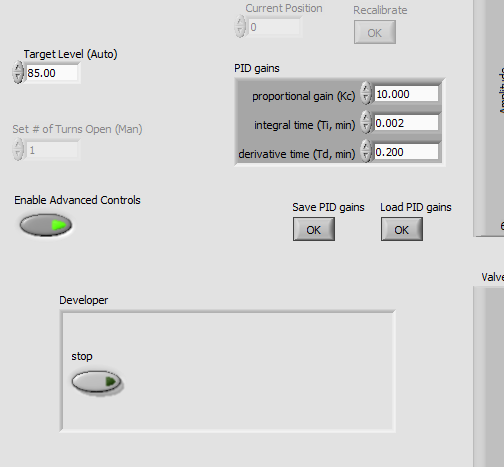
Lastly, in the bottom left hand corner of the VI is the option to enable advanced controls for the PID loop. If this icon is selected, the PID gains table will appear to its right. The pid loop uses a PID controller and equation constants to run and maintain the level. Unless you have a deep understanding of these coeffecients and need to make edits to them to increase the VI's efficiency, do not try to change these values. If advanced controls are enabled, and the VI is in manual mode, the option is given to recalibrate the current position of the valve. If it is in automatic mode, then the option to change the equation constants is enabled as well.
There are also two OK buttons to "Save PID gains" and "Load PID gains". Selecting the former of the two will prompt you to create a file that will house the current PID gains in the controls box, while the latter will prompt you to select a file to load PID gains from (i.e. the file that you had created earlier). This allows you to store PID gains that you know work well, in case you wanted to experiment with the coefficients.
At the bottom there is the developer table which contains the stop bool, which basically does the same thing as deselecting the "Run VI" bool (turning off the program).
Code
The entirety of the Response VI code is contained within a while loop, in which each iteration lasts 1 second and which can only be stopped by either an error in either VI (while they are running simultaneously) or if the VI is stopped with the use of the stop bool in the developer box.
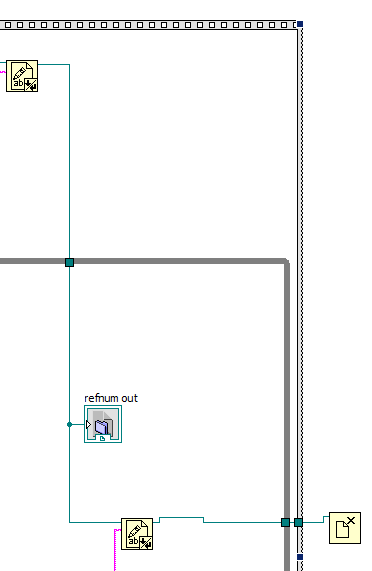
File IO
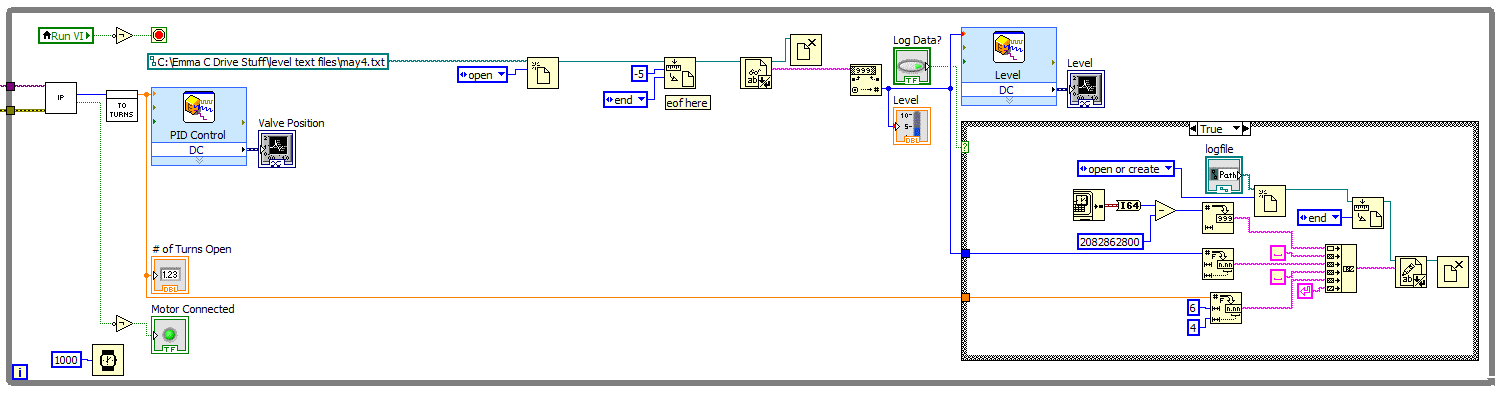
The File IO in the Response VI appears very similar to that of the Measuring VI. It begins with opening the desired text file containing the Measuring VI data, which is defined by the user, and uses the last 3 characters for that iteration while the VI is running. The last three characters represent the level of the system. This information is then converted from a string to a numeric, and the text file is closed. The level data is then outputted into a graph which represents the level with respect to time.
On the right side of the above image, there is a case structure that is activated when the user selects the bool "Log Data?". Selecting this icon in the VI interface sets the case as true, which activates the assembly of a text file which contains data for the Date/Time Stamp in unix, the current level and finally the valve position, which will be read into the Measuring VI (see LINK). All this data is taken into a string concatenator and written into the text file path supplied by the user. Then the text file is closed in the case structure. If the case was set to false, then no text file would have been written or even opened.
Enabling Advanced Controls
Advanced Controls should only be enabled by someone who understands the mathematics behind the PID Response - otherwise, the default values should be left alone. Because of this, the code is set up to display a warning to the user, and presents them with two options: Enable or OK. If Enable is selected, the user will be able to access advanced controls, and if OK is selected, they cannot access them. This occurs in the first sequence of the sequence structure, which means that the controls are changed before the PID response is calculated for that iteration. Additionally, if Advanced Controls are enabled, then the box containing the PID gains appears in the interface.

If Advanced Controls are not enabled, then the box is disabled and grayed out in the first while loop.
VISAs
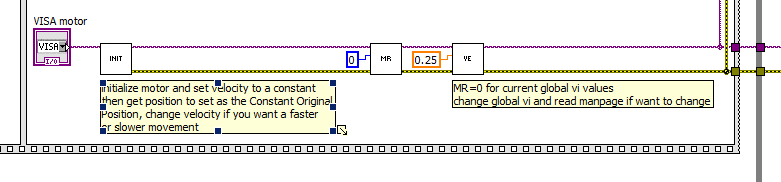
The VISA motor is whatever motor the user defines in the interface. This VISA is used as the object of all the commands and prompts written by the command VIs, which are listed and explained below.
Command VIs
As you can see there are also several smaller sub VIs that are instrumental to the response VI as a whole. These are called the command VIs, and they perform varying functions, which will be listed below, to help the main VI run as a whole.
init.vi
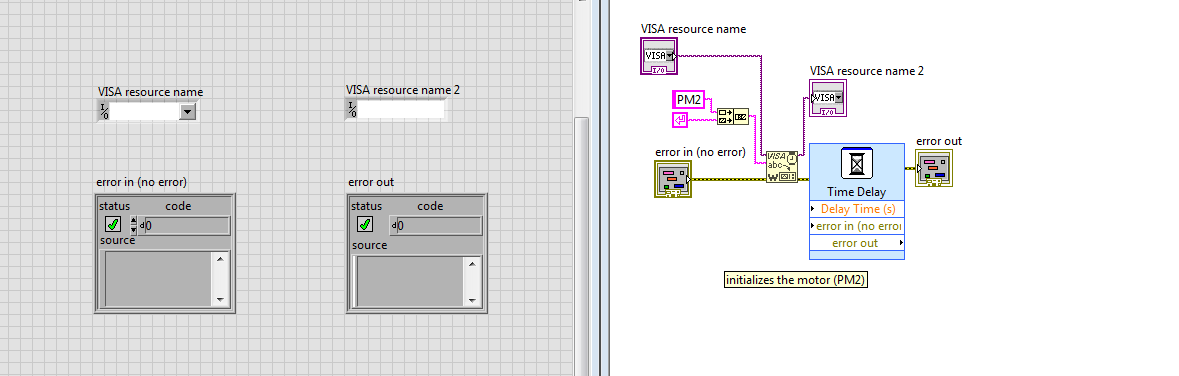
- initializes the motor by writing that motor to the VISA.
microstep_revolution.vi
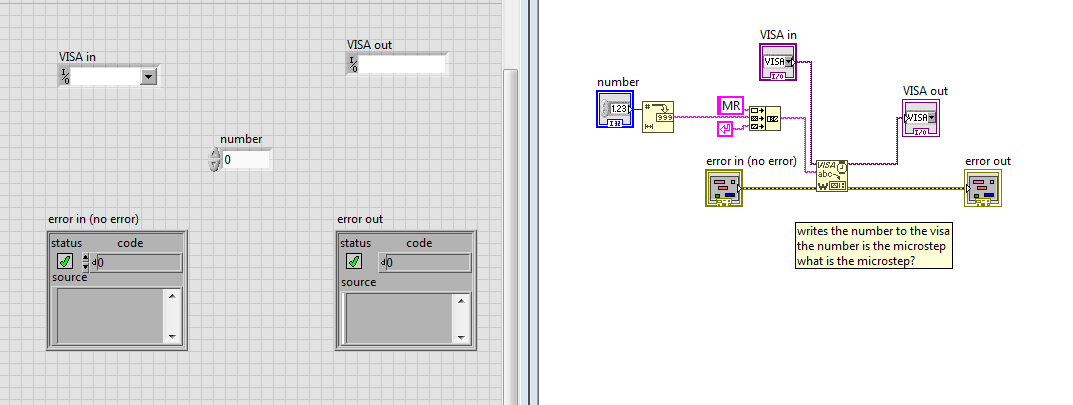
- writes a constant "number" to the VISA.
- "number" is the _________.
setvelocity.vi
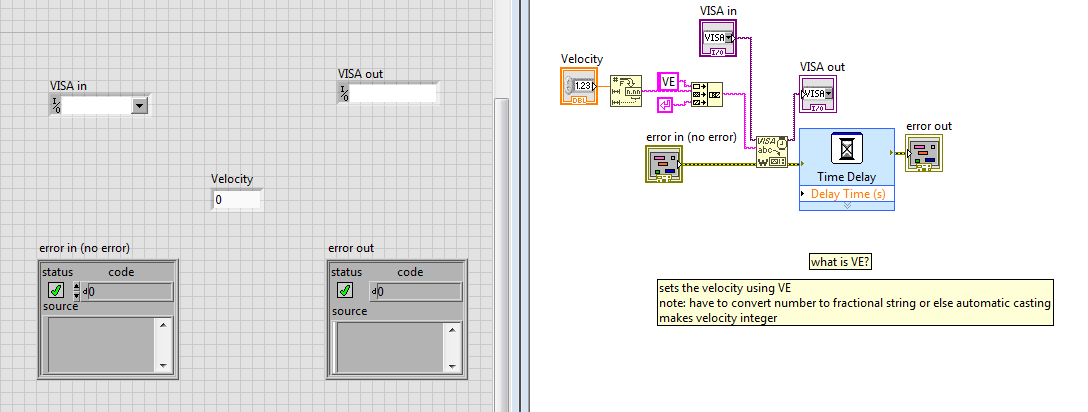
- writes the constant "Velocity" to the VISA.
- "Velocity" is the speed at which the motor spins.
getposition.vi
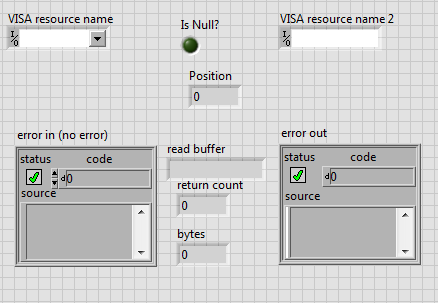
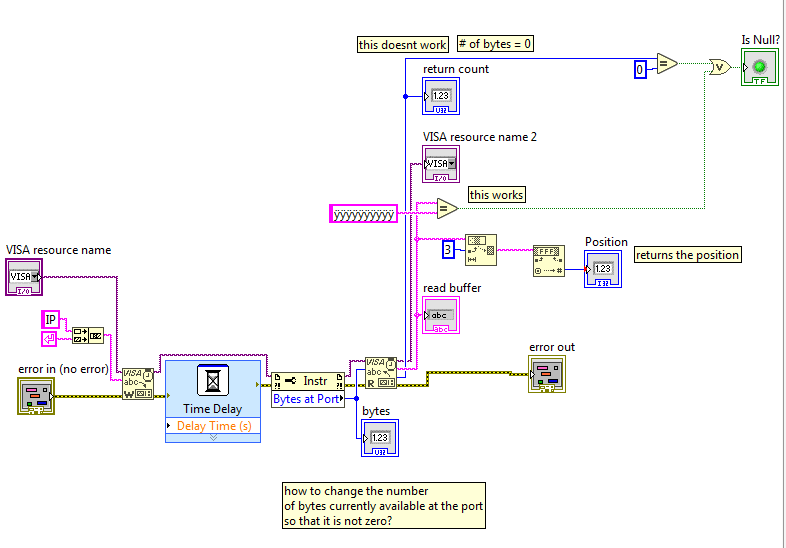
- using the VISA indicated, this VI tells the user if the VISA is able to be used or not by indicating if "Is Null?" is true or false.
- True: the bool is activated and the VISA is null, and therefore not able to be used.
- False: the bool remains inactive and the VISA is not null, and therefore can be used.
- The VISA can be null if one of two scenarios are true:
- if the number of bytes available at the VISA's port is equal to zero AND/OR
- if the valve position returned is not readable to the VI.
- If both of these cases are false, then the VISA is not null and the valve position is returned.
to_turns.vi
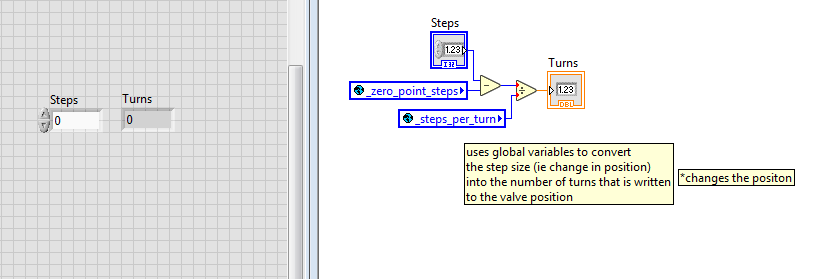
- uses predefined global variables to convert from the number of steps, which is how LabVIEW reads the change in height of the valve, to the number of turns, which is how the motor knows how much to open.
- basically this VI uses a conversion to create a number that is readable to the motor.
to_steps.vi
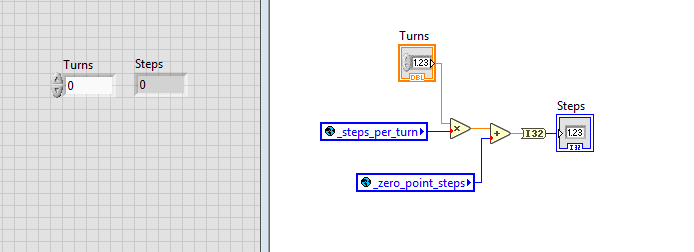
- this VI uses the same idea as to_turns, but it converts the other way around, therefore converting the valve's change in position into a number readable to LabVIEW.
sanitize_io.vi

- this VI uses an input (valve position) value (in steps) and determines the "sanitized input", or the edited input once maximum and minimum values are taken into account.
- this VI exists so that the VI never writes a position that exceeds the limits defined by the user (under the controls "min open" and "max open").
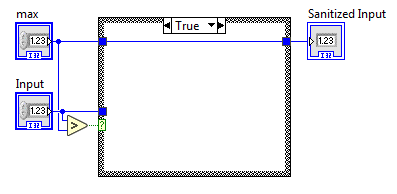
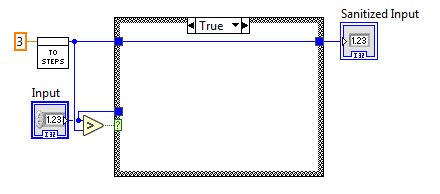
- as you can see above, there are three specific cases for the VI:
- True,None: if case 1 is true, then the input position is greater than the max position of the valve. In this case. then the max position of the valve is written as the sanitized input and case 2 is irrelevant.
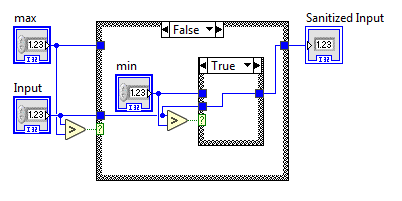
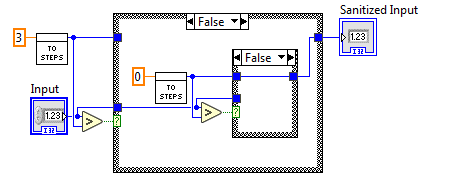
- False,True: if case 1 is false and case 2 is true, then that means that the input position is less than the max position of the valve and is greater than the min position. In this case, the input value is valid and remains as the sanitized input value.
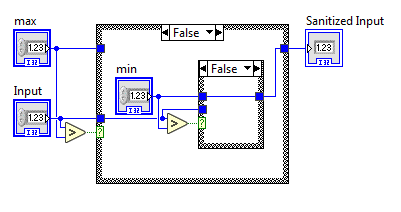
- False,False: if both case 1 and 2 are false, then the input value is less than not only the max value, but the min value as well, so the min value is written as the sanitized input.
sanitize.vi

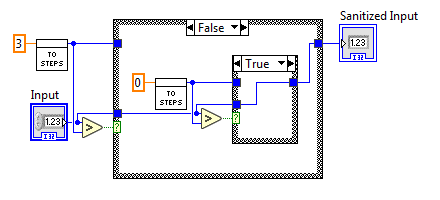
- this VI is nearly identical to the other sanitizing VI, except this one ensures that a position is never written that defies the limits of operation of the valve as a mechanical device (for the valve in our lab, the min and max positions are, respectively, 0 and 3 turns, which in the VI are immediately converted into steps).
- The input is still collected in steps and the sanitized input is still returned in steps, but in a value that is able to be read into the motor controlling the valve without breaking it.
Manual Mode
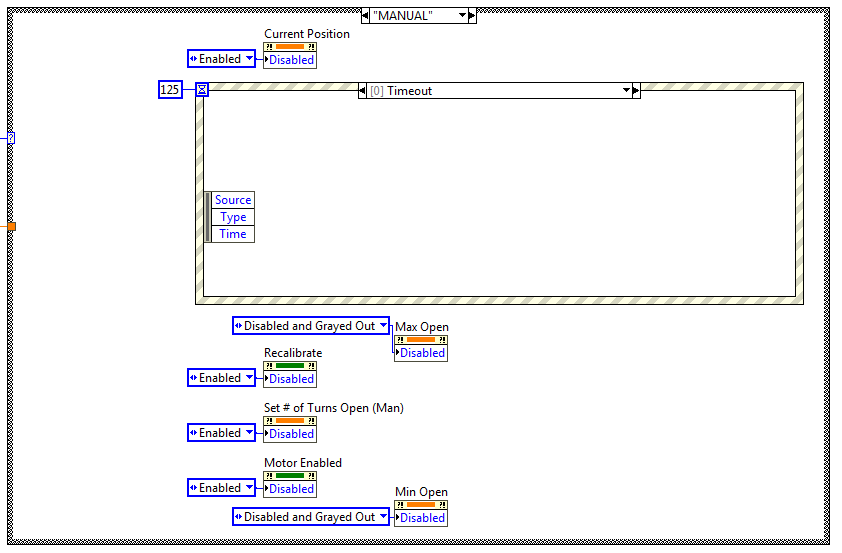
In manual mode, the user has the option to change the valve position manually, and the PID loop is not active. The min and max open controls are grayed out, as that is only for the PID loop. The "Current Position", "Recalibrate", "Set # of Turns Open (Man)" controls and the "Motor Enabled" bool are all enabled.
There is also a case structure with four different cases. The case in the above picture is Case 0, which is the default case where nothing happens if none of the above controls or bools are changed or activated.
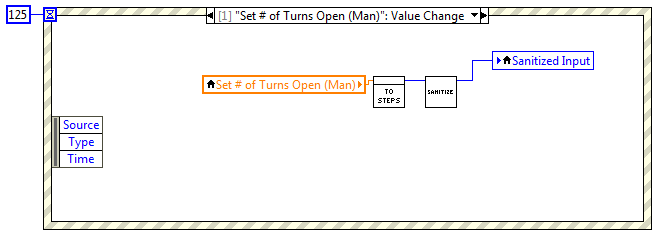
Case 1 (above) is activated when the user changes the number of turns using the "Set # of Turns Open (Man)" icon. This new input value is then converted into steps and then sanitized.
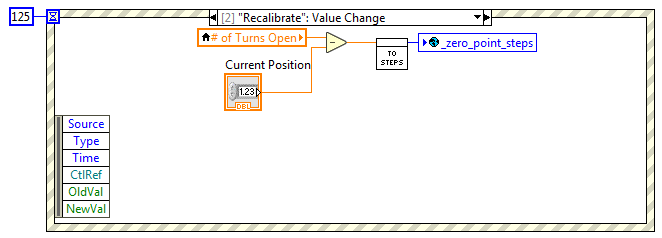
Case 2 is activated once the "Recalibrate" icon is selected. Once selected, the difference from the indicated new number of turns open and the current position is taken, converted into steps and written as the new "_zero_point_steps" (which is a global variable), or new starting position (serves the same function as zero-ing the valve position).
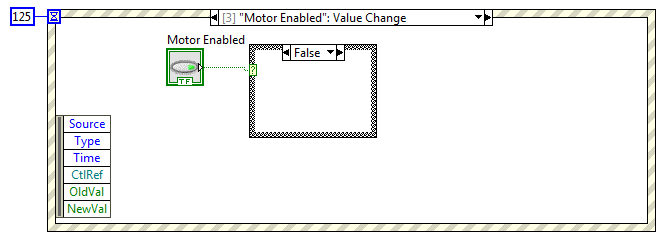
Case 3 is activated when the "Motor Enabled" bool is selected. If it is selected,nothing within the VI is changed, but because the motor is reading the position output from the VI the physical position of the motor changes with it.
Automatic Mode
In automatic mode, the VI reads the level and, from it, produces a new valve position to bring the level closer to the target level. In this mode, the PID loop is active and continuously reading the level and assigning a new valve position.
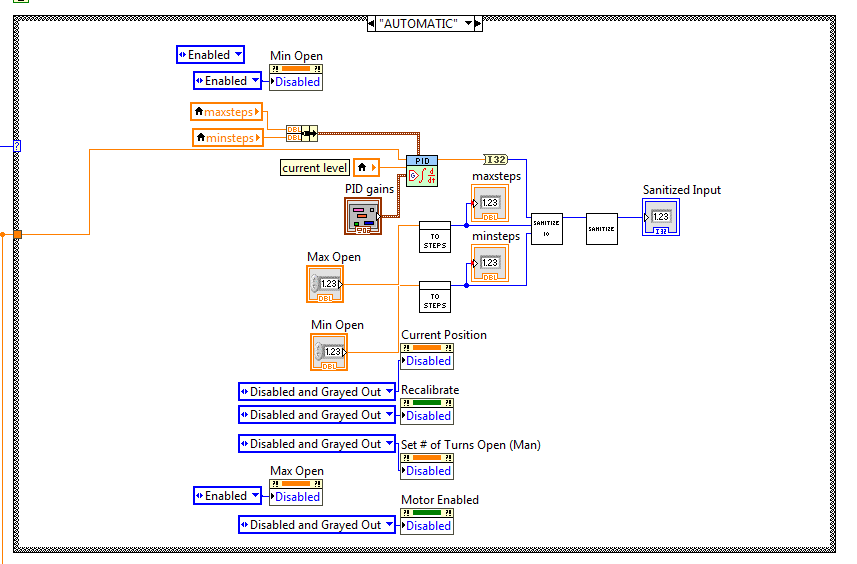
In this mode, the "Current Position", "Recalibrate", "Set # of Turns Open (Man)" controls and the "Motor Enabled" bool are all disabled and grayed out, but the "Min Open" and "Max Open" controls are enabled. The Min and Max Open values are set by the user, and represent the minimum position that the valve can close to and the maximum position it can open to while running. These values can be changed while the PID loop is active.
The Proportional-Integral-Derivative (PID) Response
The PID response operates by calculating an error from the designated target level and corrects that by using proportional, integral and derivative terms.
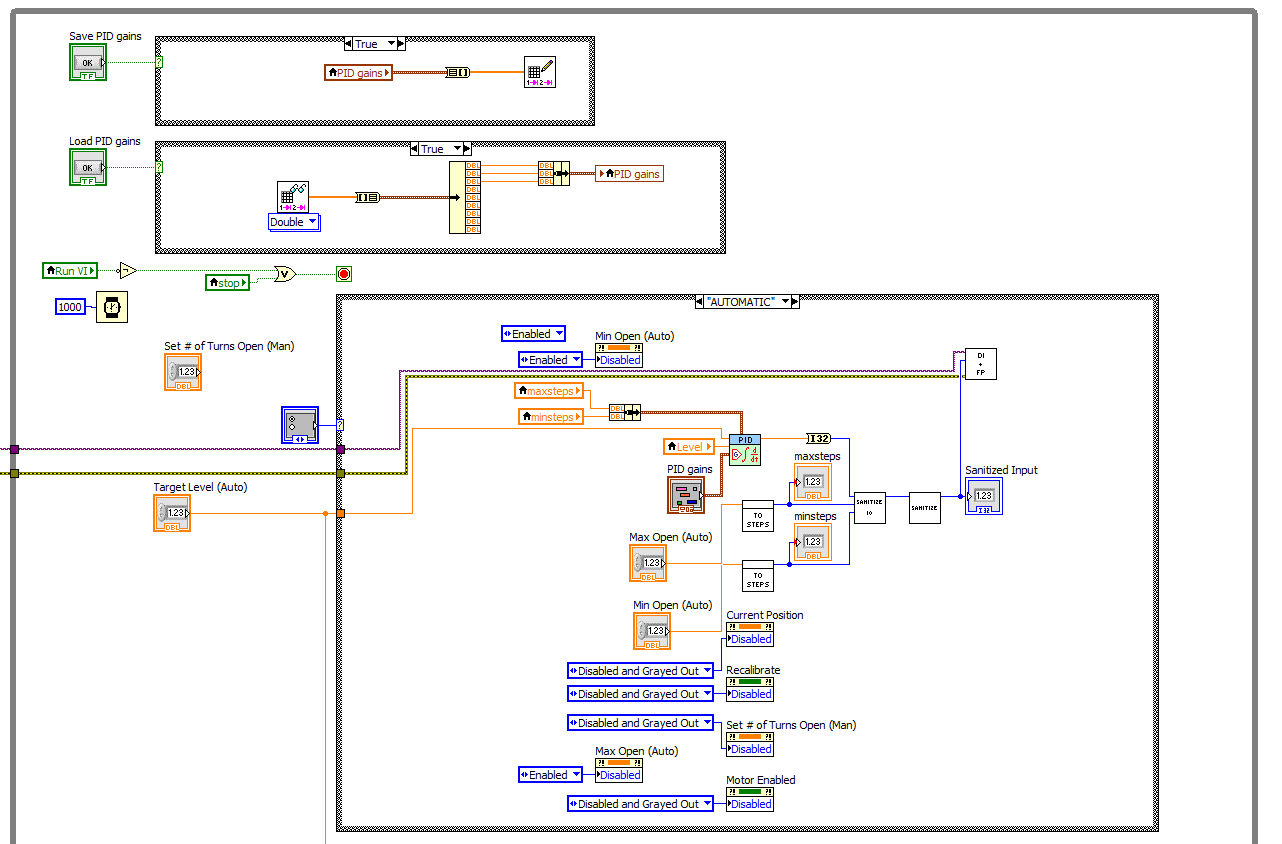
The above picture shows the code which creates the PID response. In short, the PID loop takes the current level and the target level and compares them to determine what the new valve position should be. It also takes into account the min and max open positions, and converts them to steps. It uses these positions to edit the new position created by the PID loop to ensure its validity.
If you want to change the PID gains or are interested in the mathematics behind the PID response, visit my page (yep that is a shameless plug) on Creating the PID Response.
The image above (from top to bottom) shows how the current level is subtracted from the target level for each iteration, and this data is then used to produce the error graph, which plots the current error from the target level with respect to time.
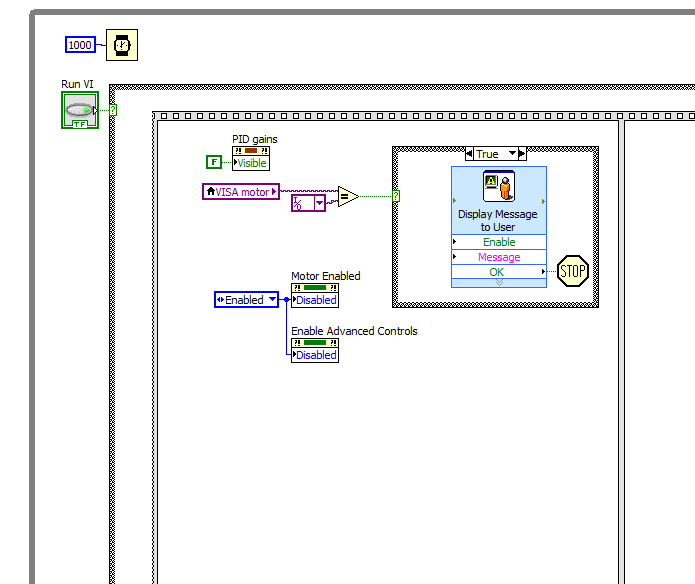
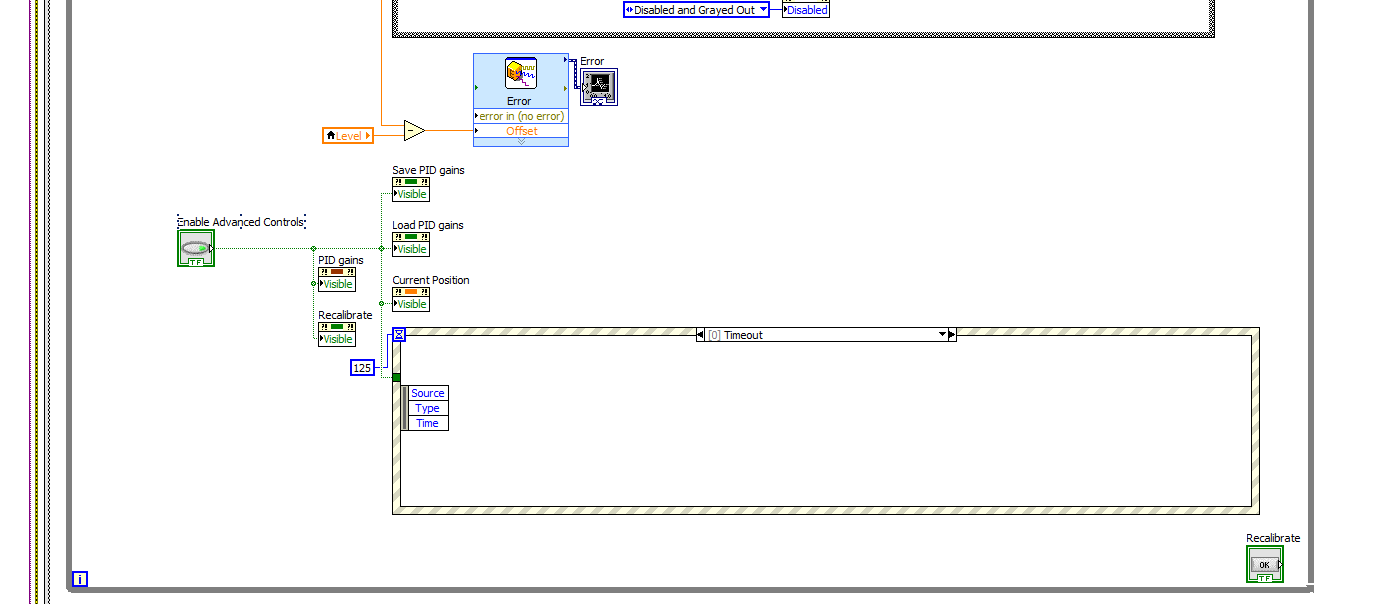
Below this is the event structure that is designed to activate when the "Enable Advanced Controls" bool is selected. Once the condition is activated, the ____ indicating the "PID gains", "Recalibrate", "Save PID gains", "Load PID gains" and "Current Position" become visible. The event structure runs for 125 milliseconds, and has two cases: (0) Timeout, and (1) Enable Advanced Controls. Case (0) is irrelevant is it shows that nothing occurs during a timeout.
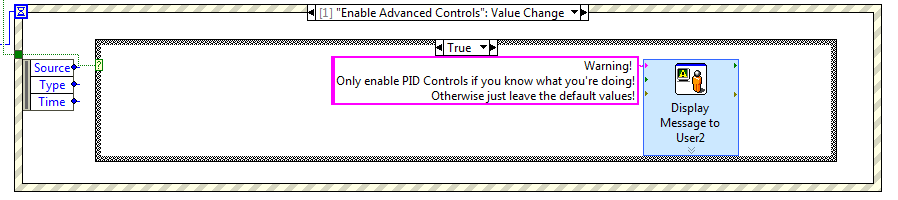
Case (1), shown above, contains a case structure that is wired to the bool, "Enable Advanced Controls". If the bool is True, then a message first appears to the user warning them about changing the default values of the PID Controls. The values should not be changed if the user does not have an understanding of the PID coefficients.
Connecting the Motor
In order to connect your computer to the motor...
- make sure that the "Motor Enabled" bool is activated, and that the correct COMPort is selected.
- connect your USB Port to a Serial Port. This conversion is necessary in order to make your computer's code readable to the step driver.
- the step motor driver should be connected to a) a Power Box, b) the other end of that aforementioned Serial Port and c) a wire that eventually connects to the motor itself. Information on where to insert what should be evident on the box itself.
- make sure that the wire leading to the step motor driver is actually connected to the motor (I have forgotten to do this many times, please check!!!).
Running the VIs (No LHe)
Below are a few steps to running both the Measuring and Response VIs simulataneously...
- Ensure that all controls in both VIs are accounted for. In the Response VI this includes...
- text file paths are indicated, preferably in the computer's hard drive
- min and max valve position
- target level
- the COMPort is correctly configured
...and in the Measuring VI...
- the text filepath is indicated in the same folder as the response file on the computer's hard drive
- the standard deviation, which shouldn't be any greater than 1 - Follow the steps in "Connecting the Motor" (above) and set up the connection between the valve motor and the computer.
- In the response VI:
- the Run VI icon at the top left should be green
- the "Motor Connected" bool icon will be red when the VI is not running, but if it does not turn green after about a second of the VI running then the motor is not connected
- if you want the VI to automatically change the valve position for a trial, then you should select automatic. This should be done after the connection between the VI and the motor are tested (see Step 3).
- the Log Data icon should be green
- the Motor Enabled icon should be green, but grayed out
- When you initialize the valve position, it is important that the valve be completely closed, and that zero is set as the initial position. If this is not done successfully then there is a risk of the valve overturning and breaking. Likewise, the constant velocity should not be too fast in order to prevent the valve from slipping while the program is running.
- Before running the VIs, you should do a test of the Response VI to make sure everything is working properly. This is done by enabling manual mode and changing the set number of turns open icon to any number between 0 and 3. make sure the "Log Data?" bool is selected, as this will create logfile.txt, the text file needed to run a trail in automatic mode. Once it is determined that this does in fact change the run valve position connected to the motor, then the VI is connected correctly. Once you are done testing, and logfile.txt has been created, automatic mode should be reselected in order to run a trial.
When the above steps are completed, and the Response VI test has run in manual mode successfully, the two VIs are ready to be run simultaneously. Simply click the run button of both VIs. If this is the first time using the Measuring VI text file you have indicated, you will need to run the Measuring VI first.
Running the Response VI (with LHe)
Below are steps needed to run the Response VI with an actual level probe during a real run involving LHe.
- Prior to testing, make sure that...
- the LHe level probe is securely fastened in the LHe reservoir
- the motor is connected to the computer and the Response VI has direct communication with it (this can be determined by checking to see if the "Motor Enabled" and "Motor Connected" bools are activated).
- When testing with LHe, it is not necessary to log data as far as the valve position and the timestamp are concerned. This is up to personal preference, but is always a good idea to collect as much data as possible.
- The same thing applies as far as calibrating the default (zero) position in this situation... when you initialize the valve position, it is important that the valve be completely closed, and that zero is set as the initial position. If this is not done successfully then there is a risk of the valve overturning and breaking. Likewise, the constant velocity should not be too fast in order to prevent the valve from slipping while the program is running.
- Finally, once the Response VI is running, you should go check and see that the motor is actively running and that the valve is not slipping (the motor is in sync with the valve and they don't become out of sync during a sharp turn in the other direction - this can cause problems for your valve and may result in something breaking if you don't address the issue).
Retrieving Data from Text Files
Readable data is retrieved from the VI in a format of a text file, for the purpose of converting the collected data into a format that is easily understood by the user.
There are two main text files that would be constantly in use during a test. This includes the Response VI text file, logfile.txt, and the Measuring VI text file, which should be changed with each test, preferably to the date or time the test took place.
Text files were used as a means of providing constant communication between the two VIs while running, as both can be changed and saved during each iteration, so that the data from the last iteration is extracted. This is the case for both text files.

I recommend putting all your text files in a folder on the same drive as your LabVIEW codes (as shown above).
Response VI Text File, logfile.txt
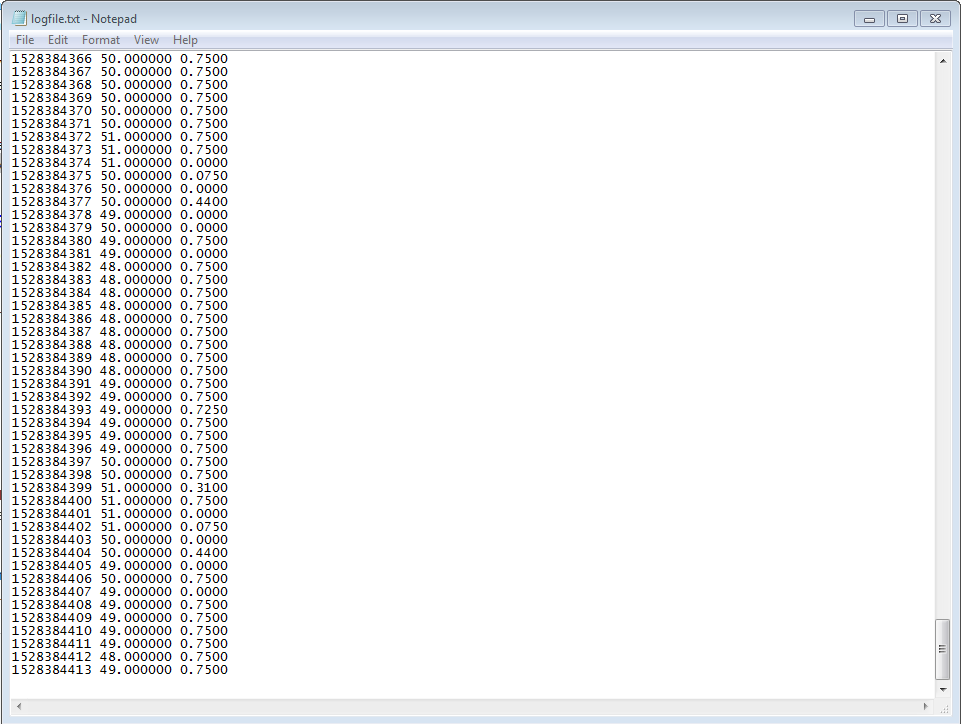
logfile.txt is the name of the data file produced by the Response VI, and namely contains the new valve position and the last recorded level in the tank. This text file is created in the Response VI and referred to in the Measuring VIs. It also contains the enoch timestamp.
Only one logfile will ever be created once you have run the two programs successfully, as the new data is appended to the old data during each run. If you have not previously created a logfile, then you should create one by first running the VI in manual mode and changing the position a few times. This will give the logfile a start at which, if you want to immediately start testing in automatic mode, the Measuring VI can read the valve position and both VIs can run.
Measuring VI text file
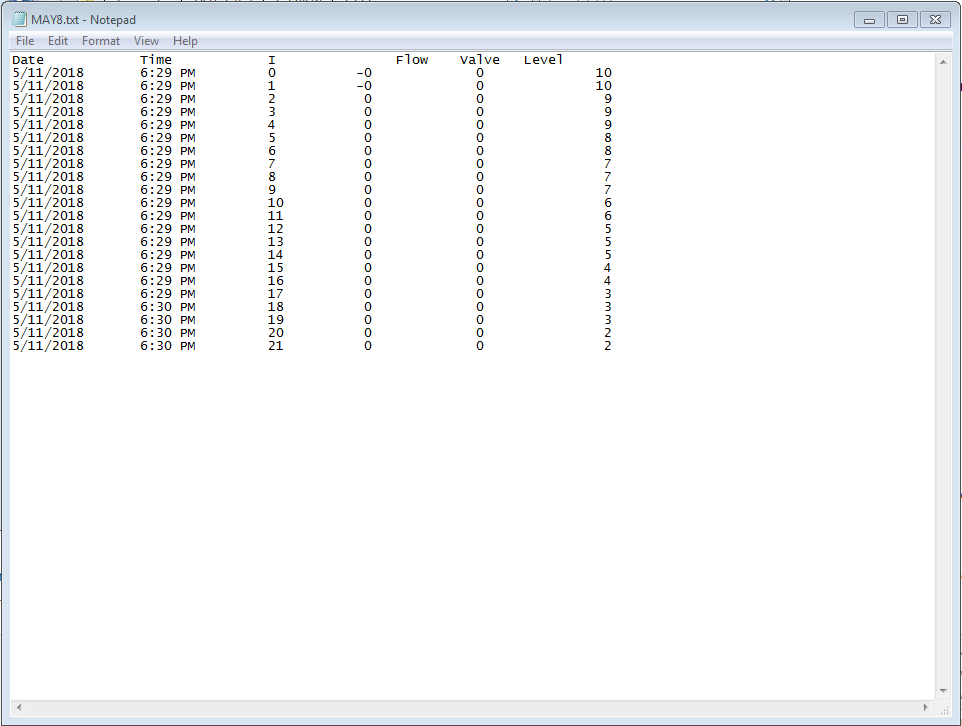
The measuring VI text file contains the date and timestamp, iteration number, new flow rate based on the valve position, the valve position recorded from the Response VI, and the new level created by the Measuring VI.
If you want to save the data from your trials, you should change the name of this text file every time before you begin running.
Possible Bugs and Issues
There are a few issues that could come up while using the VIs, especially the Response VI due to its complexity. Some are listed (with their possible solutions) below:
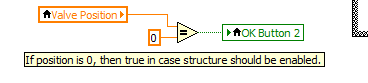
- if you are in automatic mode and switch to manual, you may not be able to change the value of the valve position the first time if it is the same value that the VI was trying to write to when automatic mode ended (ex: if auto wrote zero to the # of turns open but didn't quite get there, and you are trying to write zero under the #of turns open (man) but its not working, this is likely your issue). This happens because those control values are currently operating in a way where they only change when the value specified changes, not when the user presses enter. A temporary fix would be to just write a negative number to the valve position, as the code is designed to immediately convert any number less than zero to simply zero. A better method is currently in development, by changing the property of the controls so that they change anytime the user signals it (ie the enter key) instead of whenever the actual value is changed.
Other How-to Webpages
CONGRATS ON MAKING IT TO THE END!!! (or maybe you just scrolled down here)
Please indulge in this quality image of an inspirational kitten. - E ![]()
